File Name: VolatilityEntryAdvisor.efs, VolatilityProfitIndicator.efs, VolatilityTrailingStopP15.efs
Description:
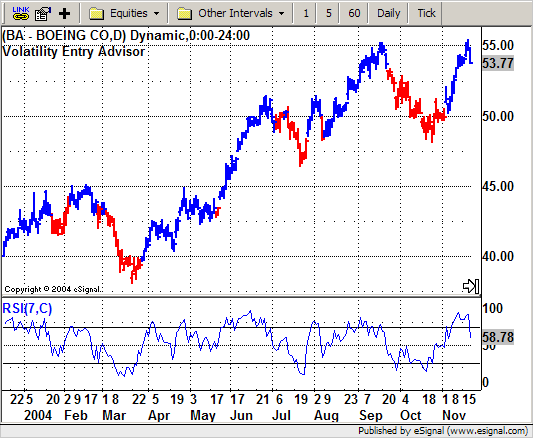
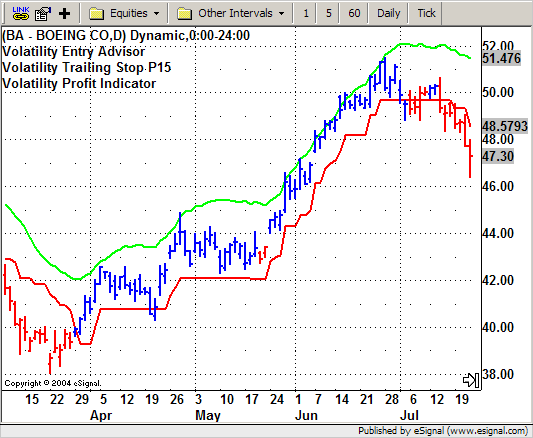
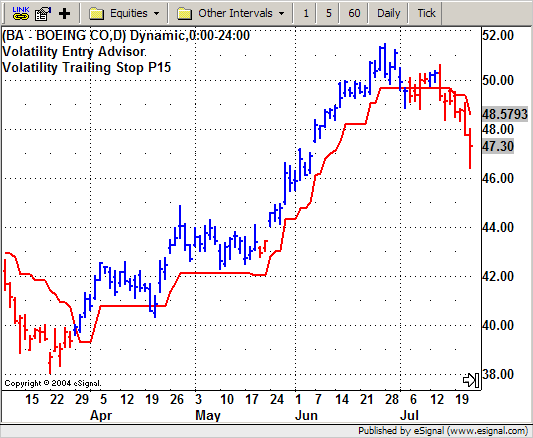
These indicators are based on the February 2005 article, The Truth About Volatility, by Jim Berg.
Formula Parameters:
VolatilityEntryAdvisor.efs
ATR Periods: 10
LL and HH Periods: 20
Thickness: 2
VolatilityProfitIndicator.efs
ATR Periods: 10
MA Periods: 13
Thickness: 2
VolatilityTrailingStopP15.efs
ATR Periods: 10
Thickness: 2
Notes:
The related article is copyrighted material. If you are not a subscriber of Stocks & Commodities, please visit www.traders.com.
Download File:
VolatilityEntryAdvisor.efs
VolatilityProfitIndicator.efs
VolatilityTrailingStopP15.efs


EFS Code:
Description:
These indicators are based on the February 2005 article, The Truth About Volatility, by Jim Berg.
Formula Parameters:
VolatilityEntryAdvisor.efs
ATR Periods: 10
LL and HH Periods: 20
Thickness: 2
VolatilityProfitIndicator.efs
ATR Periods: 10
MA Periods: 13
Thickness: 2
VolatilityTrailingStopP15.efs
ATR Periods: 10
Thickness: 2
Notes:
The related article is copyrighted material. If you are not a subscriber of Stocks & Commodities, please visit www.traders.com.
Download File:
VolatilityEntryAdvisor.efs
VolatilityProfitIndicator.efs
VolatilityTrailingStopP15.efs


EFS Code:
PHP Code:
/*************************

Provided By : eSignal (c) Copyright 2004

Description:  Volatility Entry Advisor - by Jim Berg


Version 1.1


Notes:

2/15/2005 - Added setComputeOnClose()


February 2005 Issue - "The Truth About Volatility"


Formula Parameters:                 Defaults:

ATR Periods                         10

LL and HH Periods                   20

Thickness                           2

*************************/


function preMain() {

    setPriceStudy(true);

    setStudyTitle("Volatility Entry Advisor ");

    setCursorLabelName("Entry", 0);

    setCursorLabelName("Exit", 1);

    setDefaultBarThickness(2, 0);

    setDefaultBarThickness(2, 1);

    setDefaultBarFgColor(Color.green, 0);

    setDefaultBarFgColor(Color.khaki, 1);


    setColorPriceBars(true);

    setDefaultPriceBarColor(Color.grey);

    setComputeOnClose();


    setShowTitleParameters(false);


    // Formula Parameters

    var fp1 = new FunctionParameter("nATRlen", FunctionParameter.NUMBER);

        fp1.setName("ATR Periods");

        fp1.setLowerLimit(1);

        fp1.setDefault(10);

    var fp2 = new FunctionParameter("nDonlen", FunctionParameter.NUMBER);

        fp2.setName("LL and HH Periods");

        fp2.setLowerLimit(1);

        fp2.setDefault(20);


    // Study Parameters

    var sp1 = new FunctionParameter("nThick", FunctionParameter.NUMBER);

        sp1.setName("Thickness");

        sp1.setDefault(2);

}


var bEdit = true;

var vATR = null;

var vDonchian = null;

var vColor = Color.grey;


function main(nATRlen, nDonlen, nThick) {

    if (bEdit == true) {

        vATR = new ATRStudy(nATRlen);

        vDonchian = new DonchianStudy(nDonlen, 0);

        setDefaultBarThickness(nThick, 0);

        setDefaultBarThickness(nThick, 1);

        bEdit = false;

    }


    var nState = getBarState();

    if (nState == BARSTATE_NEWBAR) {

    }


    var ATR = vATR.getValue(ATRStudy.ATR);

    var HHV = vDonchian.getValue(DonchianStudy.UPPER);

    var LLV = vDonchian.getValue(DonchianStudy.LOWER);

    if (ATR == null || HHV == null || LLV == null) return;


    var vEntryLine = LLV+(2*ATR);

    var vExitLine = HHV-(2*ATR);

    var c = close();


    if (c > vEntryLine) {

        vColor = Color.blue;

    } else if (c < vExitLine) {

        vColor = Color.red;

    }

    setPriceBarColor(vColor);


    //return;

    return new Array(vEntryLine, vExitLine);

}


/*************************

Provided By : eSignal (c) Copyright 2004

Description:  Volatility Profit Indicator - by Jim Berg


Version 1.0


Notes:

February 2005 Issue - "The Truth About Volatility"


Formula Parameters:                 Defaults:

ATR Periods                         10

MA Periods                          13

Thickness                           2

*************************/


function preMain() {

    setPriceStudy(true);

    setStudyTitle("Volatility Profit Indicator ");

    setCursorLabelName("VProfit", 0);

    setDefaultBarThickness(2, 0);

    setDefaultBarFgColor(Color.lime, 0);


    setShowTitleParameters(false);


    // Formula Parameters

    var fp1 = new FunctionParameter("nATRlen", FunctionParameter.NUMBER);

        fp1.setName("ATR Periods");

        fp1.setLowerLimit(1);

        fp1.setDefault(10);

    var fp2 = new FunctionParameter("nMovlen", FunctionParameter.NUMBER);

        fp2.setName("MA Periods");

        fp2.setLowerLimit(1);

        fp2.setDefault(13);


    // Study Parameters

    var sp1 = new FunctionParameter("nThick", FunctionParameter.NUMBER);

        sp1.setName("Thickness");

        sp1.setDefault(2);

}


var bEdit = true;

var vATR = null;

var vMA = null;


function main(nATRlen, nMovlen, nThick) {

    if (bEdit == true) {

        vATR = new ATRStudy(nATRlen);

        vMA = new MAStudy(nMovlen, 0, "High", MAStudy.EXPONENTIAL);

        setDefaultBarThickness(nThick, 0);

        bEdit = false;

    }


    var nState = getBarState();

    if (nState == BARSTATE_NEWBAR) {

    }


    var ATR = vATR.getValue(ATRStudy.ATR);

    var MA = vMA.getValue(MAStudy.MA);

    if (ATR == null || MA == null) return;


    var vProfitLine = (MA + (2*ATR));


    return vProfitLine;

}


/*************************

Provided By : eSignal (c) Copyright 2004

Description:  Volatility Trailing Stop P15 - by Jim Berg


Version 1.0


Notes:

February 2005 Issue - "The Truth About Volatility"


Formula Parameters:                 Defaults:

ATR Periods                         10

Thickness                           2

*************************/


function preMain() {

    setPriceStudy(true);

    setStudyTitle("Volatility Trailing Stop P15 ");

    setCursorLabelName("VStop", 0);

    setDefaultBarThickness(2, 0);

    setDefaultBarFgColor(Color.red, 0);


    setShowTitleParameters(false);


    // Formula Parameters

    var fp1 = new FunctionParameter("nATRlen", FunctionParameter.NUMBER);

        fp1.setName("ATR Periods");

        fp1.setLowerLimit(1);

        fp1.setDefault(10);


    // Study Parameters

    var sp1 = new FunctionParameter("nThick", FunctionParameter.NUMBER);

        sp1.setName("Thickness");

        sp1.setDefault(2);

}


var bEdit = true;

var vATR = null;

var aStop = new Array(15);


function main(nATRlen, nThick) {

    if (bEdit == true) {

        vATR = new ATRStudy(nATRlen);

        setDefaultBarThickness(nThick, 0);

        bEdit = false;

    }


    var nState = getBarState();

    if (nState == BARSTATE_NEWBAR) {

        aStop.pop();

        aStop.unshift(0);

    }


    var ATR = vATR.getValue(ATRStudy.ATR);

    if (ATR == null) return;


    var c = close();

    var vStop = (c - (2*ATR));

    aStop[0] = vStop;


    var vStop15 = vStop;

    for (var i = 0; i < 15; i++) {

        vStop15 = Math.max(aStop[i], vStop15);

    }


    return vStop15;

}