 Tweet
Tweet
File Name: Directional_Breakout.efs, Directional_Breakout_ColorBars.efs
Description:
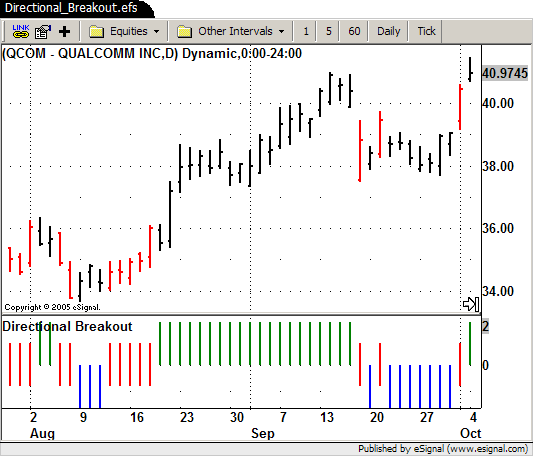
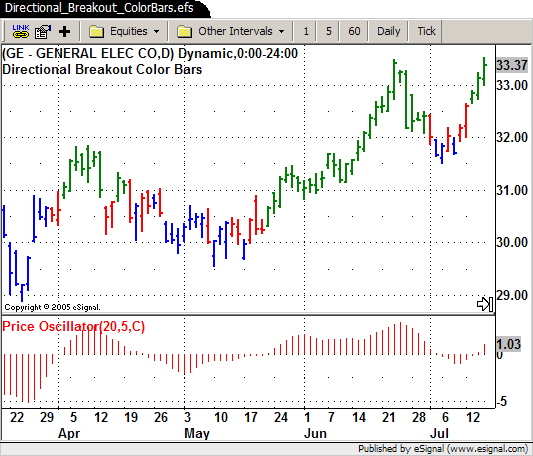
These indicators are based on the February 2005 article, Directional Breakout Indicator, by Barbara Star, PhD.
Formula Parameters:
Directional_Breakout.efs
Length: 20
Offset: 0
Source: Close
Type: SIMPLE
Histogram Positive Color: Green
Histogram Zero Color: Red
Histogram Negative Color: Blue
Price Bars Positive Color: Black
Price Bars Zero Color: Red
Price Bars Negative Color: Black
Directional_Breakout_ColorBars.efs
Length: 20
Offset: 0
Source: Close
Type: SIMPLE
Positive Color: Green
Zero Color: Red
Negative Color: Blue
Notes:
The related article is copyrighted material. If you are not a subscriber of Stocks & Commodities, please visit www.traders.com.
Download File:
Directional_Breakout.efs
Directional_Breakout_ColorBars.efs
EFS Code:
Description:
These indicators are based on the February 2005 article, Directional Breakout Indicator, by Barbara Star, PhD.
Formula Parameters:
Directional_Breakout.efs
Length: 20
Offset: 0
Source: Close
Type: SIMPLE
Histogram Positive Color: Green
Histogram Zero Color: Red
Histogram Negative Color: Blue
Price Bars Positive Color: Black
Price Bars Zero Color: Red
Price Bars Negative Color: Black
Directional_Breakout_ColorBars.efs
Length: 20
Offset: 0
Source: Close
Type: SIMPLE
Positive Color: Green
Zero Color: Red
Negative Color: Blue
Notes:
The related article is copyrighted material. If you are not a subscriber of Stocks & Commodities, please visit www.traders.com.
Download File:
Directional_Breakout.efs
Directional_Breakout_ColorBars.efs
EFS Code:
PHP Code:
/****************

Coded By : Alexis C. Montenegro

Description:  Directional Breakout Indicator - by Barbara Star, PhD


Version 1.0


Notes:

Feb 2005 Issue - "Directional Breakout Indicator"


Formula Parameters:                 Defaults:

Length                              20

Offset                              0

Source                              Close

Type                                SIMPLE

Histogram Positive Color            Green

Histogram Zero Color                Red

Histogram Negative Color            Blue

Price Bars Positive Color           Black

Price Bars Zero Color               Red

Price Bars Negative Color           Black

****************/


var vMA = null;

var vMovAvg;

var vHist;

var vHistb;


function preMain() {

    setPriceStudy(false);

    setStudyTitle("Directional Breakout");

    setShowTitleParameters(false);

    setShowCursorLabel(false);

    setHistogramBase(0);

    setPlotType(PLOTTYPE_HISTOGRAM,0);

    setDefaultBarFgColor(Color.lightgrey,0);

    setDefaultBarThickness(2,0);

    setPlotType(PLOTTYPE_HISTOGRAM,1);

    setDefaultBarFgColor(Color.lightgrey,1);

    setDefaultBarThickness(2,1);

    setColorPriceBars(true);

    setDefaultPriceBarColor(Color.lightgrey);


    var fp1 = new FunctionParameter("Length", FunctionParameter.NUMBER);

    fp1.setLowerLimit(1);

    fp1.setDefault(20);


    var fp2 = new FunctionParameter("Offset", FunctionParameter.NUMBER);

    fp2.setDefault(0);


    var fp3 = new FunctionParameter("Source", FunctionParameter.STRING);

    fp3.setName("Source");

    fp3.addOption("Close");

    fp3.addOption("High");

    fp3.addOption("Low");

    fp3.addOption("Open");

    fp3.addOption("HL/2");

    fp3.addOption("HLC/3");

    fp3.addOption("OHLC/4");

    fp3.setDefault("Close");


    var fp4 = new FunctionParameter("Type", FunctionParameter.STRING);

    fp4.setName("Type");

    fp4.addOption("MAStudy.SIMPLE");

    fp4.addOption("MAStudy.EXPONENTIAL");

    fp4.addOption("MAStudy.WEIGHTED");

    fp4.addOption("MAStudy.VOLUMEWEIGHTED");

    fp4.setDefault("MAStudy.SIMPLE");


    var fp5 = new FunctionParameter("cPos", FunctionParameter.COLOR);

    fp5.setName("Histogram Positive Color");

    fp5.setDefault(Color.green);


    var fp6 = new FunctionParameter("cZero", FunctionParameter.COLOR);

    fp6.setName("Histogram Zero Color");

    fp6.setDefault(Color.red);


    var fp7 = new FunctionParameter("cNeg", FunctionParameter.COLOR);

    fp7.setName("Histogram Negative Color");

    fp7.setDefault(Color.blue);


    var fp8 = new FunctionParameter("cPosPB", FunctionParameter.COLOR);

    fp8.setName("Price Bars Positive Color");

    fp8.setDefault(Color.black);


    var fp9 = new FunctionParameter("cZeroPB", FunctionParameter.COLOR);

    fp9.setName("Price Bars Zero Color");

    fp9.setDefault(Color.red);


    var fp10 = new FunctionParameter("cNegPB", FunctionParameter.COLOR);

    fp10.setName("Price Bars Negative Color");

    fp10.setDefault(Color.black);

}


function main(Length,Offset,Source,Type,cPos,cZero,cNeg,cPosPB,cZeroPB,cNegPB) {


    if (vMA == null) vMA = new MAStudy(Length, Offset, Source, eval(Type));


    vMovAvg = vMA.getValue(MAStudy.MA);


    if(vMovAvg == null)

    return;


    if(low(0) > vMovAvg){

        vHist = 2;

        vHistb = 2;

        setBarFgColor(cPos, 0);

        setBarFgColor(cPos, 1);

        setPriceBarColor(cPosPB);

    }

    else if(high(0) < vMovAvg){

        vHist = -2;

        vHistb = -2;

        setBarFgColor(cNeg, 0);

        setBarFgColor(cNeg, 1);

        setPriceBarColor(cNegPB);

    }

    else{

        vHist = 1;

        vHistb = -1;

        setBarFgColor(cZero, 0);

        setBarFgColor(cZero, 1);

        setPriceBarColor(cZeroPB);

    }


    return new Array(vHist, vHistb);

}


/****************

Coded By : Alexis C. Montenegro

Description:  Directional Breakout Colored Price Bars - by Barbara Star, PhD


Version 1.0


Notes:

Feb 2005 Issue - "Directional Breakout Indicator"


Formula Parameters:                 Defaults:

Length                              20

Offset                              0

Source                              Close

Type                                SIMPLE

Positive Color                      Green

Zero Color                          Red

Negative Color                      Blue

****************/


var vMA = null;

var vMovAvg;

var vHist;

var vHistb;


function preMain() {

    setPriceStudy(true);

    setStudyTitle("Directional Breakout Color Bars");

    setShowTitleParameters(false);

    setShowCursorLabel(false);

    setHistogramBase(0);

    setPlotType(PLOTTYPE_HISTOGRAM,0);

    setDefaultBarFgColor(Color.lightgrey,0);

    setDefaultBarThickness(2,0);

    setPlotType(PLOTTYPE_HISTOGRAM,1);

    setDefaultBarFgColor(Color.lightgrey,1);

    setDefaultBarThickness(2,1);

    setColorPriceBars(true);

    setDefaultPriceBarColor(Color.lightgrey);


    var fp1 = new FunctionParameter("Length", FunctionParameter.NUMBER);

    fp1.setLowerLimit(1);

    fp1.setDefault(20);


    var fp2 = new FunctionParameter("Offset", FunctionParameter.NUMBER);

    fp2.setDefault(0);


    var fp3 = new FunctionParameter("Source", FunctionParameter.STRING);

    fp3.setName("Source");

    fp3.addOption("Close");

    fp3.addOption("High");

    fp3.addOption("Low");

    fp3.addOption("Open");

    fp3.addOption("HL/2");

    fp3.addOption("HLC/3");

    fp3.addOption("OHLC/4");

    fp3.setDefault("Close");


    var fp4 = new FunctionParameter("Type", FunctionParameter.STRING);

    fp4.setName("Type");

    fp4.addOption("MAStudy.SIMPLE");

    fp4.addOption("MAStudy.EXPONENTIAL");

    fp4.addOption("MAStudy.WEIGHTED");

    fp4.addOption("MAStudy.VOLUMEWEIGHTED");

    fp4.setDefault("MAStudy.SIMPLE");


    var fp5 = new FunctionParameter("cPos", FunctionParameter.COLOR);

    fp5.setName("Positive Color");

    fp5.setDefault(Color.green);


    var fp6 = new FunctionParameter("cZero", FunctionParameter.COLOR);

    fp6.setName("Zero Color");

    fp6.setDefault(Color.red);


    var fp7 = new FunctionParameter("cNeg", FunctionParameter.COLOR);

    fp7.setName("Negative Color");

    fp7.setDefault(Color.blue);

}


function main(Length,Offset,Source,Type,cPos,cZero,cNeg) {


    if (vMA == null) vMA = new MAStudy(Length, Offset, Source, eval(Type));


    vMovAvg = vMA.getValue(MAStudy.MA);


    if(vMovAvg == null)

    return;


    if(low(0) > vMovAvg){

        vHist = 2;

        vHistb = 2;

        setBarFgColor(cPos, 0);

        setBarFgColor(cPos, 1);

        setPriceBarColor(cPos);

    }

    else if(high(0) < vMovAvg){

        vHist = -2;

        vHistb = -2;

        setBarFgColor(cNeg, 0);

        setBarFgColor(cNeg, 1);

        setPriceBarColor(cNeg);

    }

    else{

        vHist = 1;

        vHistb = -1;

        setBarFgColor(cZero, 0);

        setBarFgColor(cZero, 1);

        setPriceBarColor(cZero);

    }


    return;

}