 Tweet
Tweet
File Name: SelfAdjRSI.efs
Description:
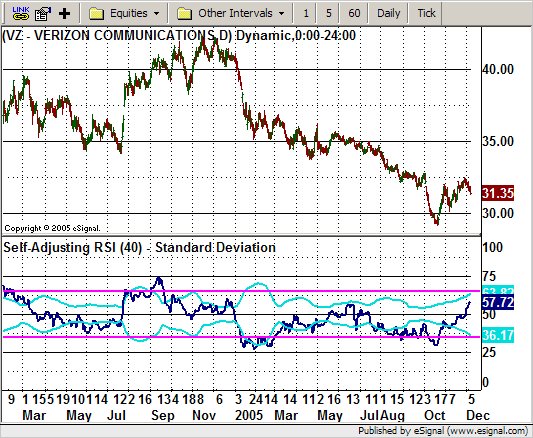
This formula is based on the February 2006 article, The Self-Adjusting RSI, by David Sepiashvili.
Formula Parameters:
RSI Periods: 14
Adjustment Type: Standard Deviation
_ [Standard Deviation, Smoothed Abs Deviation]
k Value (Standard Deviation): 1.8
c Value (Smoothed Abs Deviation): 2.0
Notes:
The study plots the standard RSI and the self-adjusting RSI overbought-oversold benchmarks. Through the Edit Studies option in the Advanced Chart, there are several study parameters that may be customized. The study parameters allow you to set the number of periods for the RSI, the Adjustment Type (Standard Deviation or Smoothed Absolute Deviation), as well as the k and c values for the respective adjustment types. The related article is copyrighted material. If you are not a subscriber of Stocks & Commodities, please visit www.traders.com.
Download File:
SelfAdjRSI.efs
EFS Code:
Description:
This formula is based on the February 2006 article, The Self-Adjusting RSI, by David Sepiashvili.
Formula Parameters:
RSI Periods: 14
Adjustment Type: Standard Deviation
_ [Standard Deviation, Smoothed Abs Deviation]
k Value (Standard Deviation): 1.8
c Value (Smoothed Abs Deviation): 2.0
Notes:
The study plots the standard RSI and the self-adjusting RSI overbought-oversold benchmarks. Through the Edit Studies option in the Advanced Chart, there are several study parameters that may be customized. The study parameters allow you to set the number of periods for the RSI, the Adjustment Type (Standard Deviation or Smoothed Absolute Deviation), as well as the k and c values for the respective adjustment types. The related article is copyrighted material. If you are not a subscriber of Stocks & Commodities, please visit www.traders.com.
Download File:
SelfAdjRSI.efs
EFS Code:
PHP Code:
/***************************************

Provided By : eSignal (c) Copyright 2005

Description:  Self-Adjusting RSI - by David Sepiashvili


Version 1.0  12/07/2005


Notes:

February 2006 Issue of Stocks and Commodities Magazine


* Study requires version 7.9 or higher.


Formula Parameters:                 Defaults:

RSI Periods                         14

Adjustment Type                     Standard Deviation

    [Standard Deviation,

     Smoothed Abs Deviation]

k Value (Standard Deviation)        1.8

c Value (Smoothed Abs Deviation)    2.0

***************************************/


function preMain() {

    setStudyTitle("Self-Adjusting RSI ");

    setShowTitleParameters(false);

    setCursorLabelName("SA Upper", 0);

    setCursorLabelName("RSI", 1);

    setCursorLabelName("SA Lower", 2);

    setDefaultBarThickness(2, 0);

    setDefaultBarThickness(2, 1);

    setDefaultBarThickness(2, 2);

    setDefaultBarFgColor(Color.aqua, 0);

    setDefaultBarFgColor(Color.navy, 1);

    setDefaultBarFgColor(Color.aqua, 2);

    addBand(65, PS_SOLID, 2, Color.magenta, "upper");

    addBand(35, PS_SOLID, 2, Color.magenta, "lower");

    setStudyMax(100);

    setStudyMin(0);


    var fp1 = new FunctionParameter("nRSIlen", FunctionParameter.NUMBER);

        fp1.setName("RSI Periods");

        fp1.setDefault(14);

    var fp2 = new FunctionParameter("sType", FunctionParameter.STRING);

        fp2.setName("Adjustment Type");

        fp2.addOption("Standard Deviation");

        fp2.addOption("Smoothed Abs Deviation");

        fp2.setDefault("Standard Deviation");

    var fp3 = new FunctionParameter("nK", FunctionParameter.NUMBER);

        fp3.setName("k Value (Standard)");

        fp3.setLowerLimit(0);

        fp3.setDefault(1.8);

    var fp4 = new FunctionParameter("nC", FunctionParameter.NUMBER);

        fp4.setName("c Value (Smoothed Abs)");

        fp4.setLowerLimit(0);

        fp4.setDefault(2);

}


var bVersion = null;

var bInit    = false;

var xRSI     = null;

var xSource  = null;


function main(nRSIlen, sType, nK, nC) {


    if (bVersion == null) bVersion = verify();

    if (bVersion == false) return;


    var nUpper = null;

    var nLower = null;


    if (bInit == false) {

        setStudyTitle("Self-Adjusting RSI (" + nRSIlen + ") - " + sType);

        //xRSI = rsi(nRSIlen);  // Enhanced RSI

        xRSI = efsInternal("StandardRSI", nRSIlen);

        xSource = efsInternal("calcSource", nRSIlen, xRSI);

        bInit = true;

    }


    if (sType == "Standard Deviation") {

        var nStdev = SD(nRSIlen);

        nUpper = 50 + (nK * nStdev);

        nLower = 50 - (nK * nStdev);

    } else if (sType == "Smoothed Abs Deviation") {

        nUpper = 50 + (nC * sma(nRSIlen, getSeries(xSource)));

        nLower = 50 - (nC * sma(nRSIlen, getSeries(xSource)));

    }


    return new Array(nUpper, xRSI.getValue(0), nLower);

}


/***** Support Functions *****/


function verify() {

    var b = false;

    if (getBuildNumber() < 700) {

        drawTextAbsolute(5, 35, "This study requires version 7.9 or later.",

            Color.white, Color.blue, Text.RELATIVETOBOTTOM|Text.RELATIVETOLEFT|Text.BOLD|Text.LEFT,

            null, 13, "error");

        drawTextAbsolute(5, 20, "Click HERE to upgrade.@URL=http://www.esignal.com/download/default.asp",

            Color.white, Color.blue, Text.RELATIVETOBOTTOM|Text.RELATIVETOLEFT|Text.BOLD|Text.LEFT,

            null, 13, "upgrade");

        return b;

    } else {

        b = true;

    }


    return b;

}


function SD(nLength) {

    var sumX = 0;

    var sumX2 = 0;

    for (i = 0; i < nLength; ++i) {

        sumX += xRSI.getValue(-i);

        sumX2 += (xRSI.getValue(-i) * xRSI.getValue(-i))

    }

    var meanX = (sumX/nLength);

    var stdev = Math.sqrt((sumX2/nLength) - (meanX*meanX));


    return stdev;

}


var xSma = null;

function calcSource(n, x) {

    if (xSma == null) xSma = sma(n, x);

    return Math.abs( x.getValue(0) - xSma.getValue(0) );

}


function StandardRSI(nInputLength) {

    var nLength = nInputLength;

    var vValue;

    var vLastClose;

    var vSumUp = 0.0;

    var vSumDown = 0.0;

    var i;

    var vRS;

    var v;


    vValue = getValue("Close", 0, -(nLength+1));

    if(vValue == null)

        return;


    var cntr = 0;

    vLastClose = vValue[nLength];

    for(i = nLength-1; i>= 0; i--) {

       v = vValue[i];

        if(v > vLastClose) {

            vSumUp += v - vLastClose;

        } else if(v < vLastClose) {

            vSumDown += vLastClose - v;

        }

        vLastClose = v;

    }


    vSumUp /= nLength;

    vSumDown /= nLength;

    vRS = 1 + (vSumUp / vSumDown);

    vValue = 100 - (100 / vRS);

    return (vValue);

}