 Tweet
Tweet
File Name: model.efs
Description:
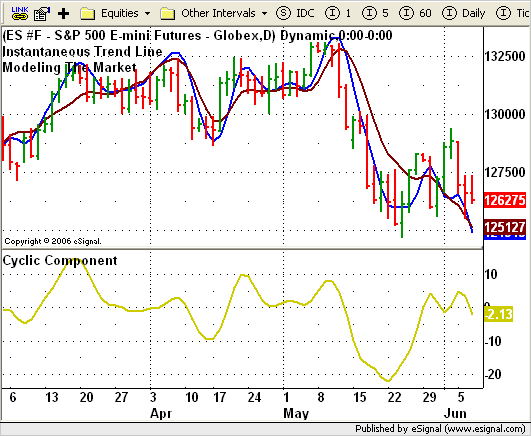
These studies are based on the August 2006 article, Modeling The Market = Building Trading Strategies, by John F. Ehlers.
Formula Parameters:
Model.efs
ITL Length: 20
CC Length: 20
CyclicComponent.efs
Length: 20
InstantaneousTrendLine.efs
Length: 20
Notes:
The Instantaneous Trend Line (ITL) and Cyclic Component (CC) studies each have one formula parameter for the period length that may be configured through the Edit Studies option in the Advanced Chart. The Model study has two length parameters, one for each the ITL and CC. The lengths for these two components of the Model study can be set at different values.
These formulas require eSignal version 8.0.0 or later. The related article is copyrighted material. If you are not a subscriber of Stocks & Commodities, please visit www.traders.com.
Download File:
Model.efs
CyclicComponent.efs
InstantaneousTrendLine.efs
EFS Code:
Description:
These studies are based on the August 2006 article, Modeling The Market = Building Trading Strategies, by John F. Ehlers.
Formula Parameters:
Model.efs
ITL Length: 20
CC Length: 20
CyclicComponent.efs
Length: 20
InstantaneousTrendLine.efs
Length: 20
Notes:
The Instantaneous Trend Line (ITL) and Cyclic Component (CC) studies each have one formula parameter for the period length that may be configured through the Edit Studies option in the Advanced Chart. The Model study has two length parameters, one for each the ITL and CC. The lengths for these two components of the Model study can be set at different values.
These formulas require eSignal version 8.0.0 or later. The related article is copyrighted material. If you are not a subscriber of Stocks & Commodities, please visit www.traders.com.
Download File:
Model.efs
CyclicComponent.efs
InstantaneousTrendLine.efs
EFS Code:
PHP Code:
/***************************************

Provided By : eSignal (c) Copyright 2006

Description:  Modeling The Market = Building Trading Strategies

              by John F. Ehlers


Version 1.0  06/05/2006


Notes:

* Aug 2006 Issue of Stocks and Commodities Magazine

* Study requires version 8.0.0 or higher.


Formula Parameters:                 Defaults:

ITL Length                          20

CC Length                           20

***************************************/


function preMain() {

    setPriceStudy(true);

    setStudyTitle("Modeling The Market ");

    setCursorLabelName("Model", 0);

    setShowTitleParameters(false);

    setDefaultBarFgColor(Color.blue, 0);

    setDefaultBarThickness(2, 0);


    var fp1 = new FunctionParameter("nLength_ITL", FunctionParameter.NUMBER);

        fp1.setName("ITL Length");

        fp1.setLowerLimit(0);

        fp1.setDefault(20);

    var fp2 = new FunctionParameter("nLength_CC", FunctionParameter.NUMBER);

        fp2.setName("CyclicC Length");

        fp2.setLowerLimit(0);

        fp2.setDefault(20);

}


var bVersion = null;

var bInit = false;


var nAlpha   = null;

var xHL2     = null;

var xHP      = null;

var nHP_1    = null;

var nHP_0    = null;

var xSMA     = null;

var xSlope   = null;


function main(nLength_ITL, nLength_CC) {

    if (bVersion == null) bVersion = verify();

    if (bVersion == false) return;


    if (bInit == false) {

        //nAlpha = (1 - Math.sin(360/nLength)) / Math.cos(360/nLength);

        /***************************************************************

            Math.sin and Math.cos in JavaScript are represented in Radians,

            TradeStations returns degrees.  To convert Math.sin(360/n) to

            Radians, replace 360 with (2*Math.PI).

            Or to convert Degrees to Radians => (Number * Math.PI) / 180

        ***************************************************************/

        nAlpha = (1 - Math.sin((2*Math.PI)/nLength_CC)) / Math.cos((2*Math.PI)/nLength_CC);

        xHL2 = hl2();

        xSMA = sma(nLength_ITL, hl2());

        xSlope = efsInternal("calcSlope", xHL2, nLength_ITL);

        xHP = efsInternal("calcHP", xHL2, nAlpha);

        bInit = true;

    }


    var nSmoothHP = null;

    var nSmoothSlope = null;

    var ITrend = null;

    var Model = null;


    if (xHP.getValue(-3) == null || xHL2.getValue(-1) == null) return;


    nSmoothHP = (xHP.getValue(0) + (2*xHP.getValue(-1)) + (2*xHP.getValue(-2)) + xHP.getValue(-3)) /6;


    if (xSlope.getValue(-3) == null) return;


    nSmoothSlope = (xSlope.getValue(0) + (2* xSlope.getValue(-1)) +

                    (2* xSlope.getValue(-2)) + xSlope.getValue(-3)) / 6;

    ITrend = xSMA.getValue(0) + (.5 * nSmoothSlope);


    Model = ITrend + nSmoothHP;


    return Model;

}


function calcHP(x, a) {

    if (nHP_1 == null) {

        nHP_1 = 0;

        return;

    } else if (getBarState() == BARSTATE_NEWBAR) {

        nHP_1 = nHP_0;

    }


    nHP_0 = (.5 * (1 + a) * (x.getValue(0) - x.getValue(-1)) + (a * nHP_1) );

    return nHP_0;

}


function calcSlope(x, n) {

    if (x.getValue(-(n-1)) == null) return;

    return (x.getValue(0) - x.getValue(-(n-1)) );

}


function verify() {

    var b = false;

    if (getBuildNumber() < 750) {

        drawTextAbsolute(5, 35, "This study requires version 8.0.0 or later.",

            Color.white, Color.blue, Text.RELATIVETOBOTTOM|Text.RELATIVETOLEFT|Text.BOLD|Text.LEFT,

            null, 13, "error");

        drawTextAbsolute(5, 20, "Click HERE to upgrade.@URL=http://www.esignal.com/download/default.asp",

            Color.white, Color.blue, Text.RELATIVETOBOTTOM|Text.RELATIVETOLEFT|Text.BOLD|Text.LEFT,

            null, 13, "upgrade");

        return b;

    } else {

        b = true;

    }


    return b;

}
PHP Code:
/***************************************

Provided By : eSignal (c) Copyright 2006

Description:  Modeling The Market = Building Trading Strategies

              by John F. Ehlers


Version 1.0  06/05/2006


Notes:

* Aug 2006 Issue of Stocks and Commodities Magazine

* Study requires version 8.0.0 or higher.


Formula Parameters:                 Defaults:

Length                              20

***************************************/


function preMain() {

    setStudyTitle("Cyclic Component ");

    setCursorLabelName("CC", 0);

    setShowTitleParameters(false);

    setDefaultBarFgColor(Color.khaki, 0);

    setDefaultBarThickness(2, 0);


    var fp1 = new FunctionParameter("nLength", FunctionParameter.NUMBER);

        fp1.setName("Length");

        fp1.setLowerLimit(0);

        fp1.setDefault(20);

}


var bVersion = null;

var bInit = false;


var nAlpha   = null;

var xHL2     = null;

var xHP      = null;

var nHP_1    = null;

var nHP_0    = null;


function main(nLength) {

    if (bVersion == null) bVersion = verify();

    if (bVersion == false) return;


    if (bInit == false) {

        nAlpha = (1 - Math.sin((2*Math.PI)/nLength)) / Math.cos((2*Math.PI)/nLength);

        xHL2 = hl2();

        xHP = efsInternal("calcHP", xHL2, nAlpha);

        bInit = true;

    }


    var nSmoothHP = null;


    if (xHP.getValue(-3) == null || xHL2.getValue(-1) == null) return;


    nSmoothHP = (xHP.getValue(0) + (2*xHP.getValue(-1)) + (2*xHP.getValue(-2)) + xHP.getValue(-3)) /6;


    return nSmoothHP;

}


function calcHP(x, a) {

    if (nHP_1 == null) {

        nHP_1 = 0;

        return;

    } else if (getBarState() == BARSTATE_NEWBAR) {

        nHP_1 = nHP_0;

    }


    nHP_0 = (.5 * (1 + a) * (x.getValue(0) - x.getValue(-1)) + (a * nHP_1) );

    return nHP_0;

}


function verify() {

    var b = false;

    if (getBuildNumber() < 750) {

        drawTextAbsolute(5, 35, "This study requires version 8.0.0 or later.",

            Color.white, Color.blue, Text.RELATIVETOBOTTOM|Text.RELATIVETOLEFT|Text.BOLD|Text.LEFT,

            null, 13, "error");

        drawTextAbsolute(5, 20, "Click HERE to upgrade.@URL=http://www.esignal.com/download/default.asp",

            Color.white, Color.blue, Text.RELATIVETOBOTTOM|Text.RELATIVETOLEFT|Text.BOLD|Text.LEFT,

            null, 13, "upgrade");

        return b;

    } else {

        b = true;

    }


    return b;

}
PHP Code:
/***************************************

Provided By : eSignal (c) Copyright 2006

Description:  Modeling The Market = Building Trading Strategies

              by John F. Ehlers


Version 1.0  06/05/2006


Notes:

* Aug 2006 Issue of Stocks and Commodities Magazine

* Study requires version 8.0.0 or higher.


Formula Parameters:                 Defaults:

Length                              20

***************************************/


function preMain() {

    setPriceStudy(true);

    setStudyTitle("Instantaneous Trend Line ");

    setCursorLabelName("ITL", 0);

    setShowTitleParameters(false);

    setDefaultBarFgColor(Color.maroon, 0);

    setDefaultBarThickness(2, 0);


    var fp1 = new FunctionParameter("nLength", FunctionParameter.NUMBER);

        fp1.setName("Length");

        fp1.setLowerLimit(0);

        fp1.setDefault(20);

}


var bVersion = null;

var bInit = false;


var xHL2   = null;

var xSMA   = null;

var xSlope = null;


function main(nLength) {

    if (bVersion == null) bVersion = verify();

    if (bVersion == false) return;


    if (bInit == false) {

        xHL2 = hl2();

        xSMA = sma(nLength, hl2());

        xSlope = efsInternal("calcSlope", xHL2, nLength);

        bInit = true;

    }


    var nSmoothSlope = null;

    var ITrend = null;


    if (xSlope.getValue(-3) == null) return;


    nSmoothSlope = (xSlope.getValue(0) + (2* xSlope.getValue(-1)) +

                    (2* xSlope.getValue(-2)) + xSlope.getValue(-3)) / 6;

    ITrend = xSMA.getValue(0) + (.5 * nSmoothSlope);


    return ITrend;

}


function calcSlope(x, n) {

    if (x.getValue(-(n-1)) == null) return;

    return (x.getValue(0) - x.getValue(-(n-1)) );

}


function verify() {

    var b = false;

    if (getBuildNumber() < 750) {

        drawTextAbsolute(5, 35, "This study requires version 8.0.0 or later.",

            Color.white, Color.blue, Text.RELATIVETOBOTTOM|Text.RELATIVETOLEFT|Text.BOLD|Text.LEFT,

            null, 13, "error");

        drawTextAbsolute(5, 20, "Click HERE to upgrade.@URL=http://www.esignal.com/download/default.asp",

            Color.white, Color.blue, Text.RELATIVETOBOTTOM|Text.RELATIVETOLEFT|Text.BOLD|Text.LEFT,

            null, 13, "upgrade");

        return b;

    } else {

        b = true;

    }


    return b;

}