 Tweet
Tweet
File Name: AutomaticTrendlines.efs
Description:
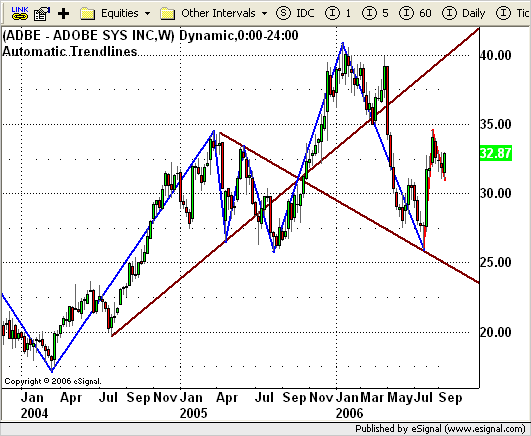
This study is based on the November 2006 article, Building Automatic Trendlines, by Giorgos E. Siligardos, PhD.
Formula Parameters:
Swing: # of Bars: 0
Swing: Wave Type: % Change in Price [% Retracement, % Change in Price]
Swing: Wave Percentage: 20
Line Thickness: 2
Confirmed Swing Line Color: Blue
Developing Swing Line Color: Red
Display Swing Labels: False
Display % Retracement Label: False
Number of Historical Labels: 100
Number of Historical Trend Lines: 10
Display Trend Lines: True
Trend Line Thickness: 2
Trend Line Color: Maroon
Notes:
The study contains several formula parameters that may be configured through the Edit Studies option in the Advanced Chart. There are several parameters that allow for the customization of the SI indicator that the trend lines are based on, which are the first three parameters. The defaults for these parameters set the SI indicator to the calculation described in the article with one exception. The percent change or percent retracement is based on the high or low of the bar for peaks and troughs, respectively. There are also parameters to control the formatting for the SI lines and the automatic trend lines as well as the colors for the most current peak or trough that is developing, but not yet confirmed. There are also two parameters that enable labels for the swings and a label for the current percent retracement value, which are both off by default. There are two parameters that can be used to limit the number of drawn swing lines and trend lines. The parameter for the trend lines sets the limit of 10 by default, which means 10 trend lines based on peaks and 10 additional trend lines based on the troughs. Lastly, there is a parameter for turning off the display of the trend lines. The related article is copyrighted material. If you are not a subscriber of Stocks & Commodities, please visit www.traders.com.
Download File:
AutomaticTrendlines.efs
EFS Code:
Description:
This study is based on the November 2006 article, Building Automatic Trendlines, by Giorgos E. Siligardos, PhD.
Formula Parameters:
Swing: # of Bars: 0
Swing: Wave Type: % Change in Price [% Retracement, % Change in Price]
Swing: Wave Percentage: 20
Line Thickness: 2
Confirmed Swing Line Color: Blue
Developing Swing Line Color: Red
Display Swing Labels: False
Display % Retracement Label: False
Number of Historical Labels: 100
Number of Historical Trend Lines: 10
Display Trend Lines: True
Trend Line Thickness: 2
Trend Line Color: Maroon
Notes:
The study contains several formula parameters that may be configured through the Edit Studies option in the Advanced Chart. There are several parameters that allow for the customization of the SI indicator that the trend lines are based on, which are the first three parameters. The defaults for these parameters set the SI indicator to the calculation described in the article with one exception. The percent change or percent retracement is based on the high or low of the bar for peaks and troughs, respectively. There are also parameters to control the formatting for the SI lines and the automatic trend lines as well as the colors for the most current peak or trough that is developing, but not yet confirmed. There are also two parameters that enable labels for the swings and a label for the current percent retracement value, which are both off by default. There are two parameters that can be used to limit the number of drawn swing lines and trend lines. The parameter for the trend lines sets the limit of 10 by default, which means 10 trend lines based on peaks and 10 additional trend lines based on the troughs. Lastly, there is a parameter for turning off the display of the trend lines. The related article is copyrighted material. If you are not a subscriber of Stocks & Commodities, please visit www.traders.com.
Download File:
AutomaticTrendlines.efs
EFS Code:
PHP Code:
/**********

Provided By : eSignal (c) Copyright 2006

Description:  Building Automatic Trendlines

              by Giorgos E. Siligardos, PhD


Version 1.0  08/31/2006


Notes:

* Nov 2006 Issue of Stocks and Commodities Magazine

* SI indicator is modified from EFS Library formula: RealTimeSwings.efs


Formula Parameters:                     Default:

    * Swing: # of Bars                  0

        This is the minimum number of bars required to define a

        swing point.  This number is for both sides of the swing

        point (i.e. 5 bars on the left and right of the swing bar).

    * Swing: Wave Type                  % Change in Price

        (% Retracement, % Change in Price)

    * Swing: Wave Percentage            20

        The number 5 will be treated as 5.0%.  The number 0.05 will

        be treated as 0.0005%.

    * Line Thickness                    2

    * Confirmed Swing Line Color        Blue

    * Developing Swing Line Color       Red

    * Display Swing Labels              False

    * Display % Retracement Label       False

    * Number of Historical Labels       100

    * Number of Historical Trend Lines  10

    * Display Trend Lines               True

    * Trend Line Thickness              2

    * Trend Line Color                  Maroon


Notes:


1.1 3/24/2004

* Added labels to display point value, % retracement, number of bars

  and price level of swings.  The number of historical labels is set

  to 100 for performance reasons.  Increase this number to view more

  historical labels.

* Added labels to display current swing's % retracement.


    Description of Swing Labels:

    At Swing Highs -  Points (% Retracement)

                      Price (Number of Bars)


    At Swing Lows -   Price (Number of Bars)

                      Points (% Retracement)


**********/


/*


The amount of code is too large for displaying in the forums.

Please open the formula in the EFS Editor from the link provided

to view the complete code.


*/