 Tweet
Tweet
File Name: RectangleBO.efs
Description:
This study is based on the June 2007 article, How Effective are Rectangles, by Markos Katsanos.
Formula Parameters:
Color: blue
Thickness: 2
Notes:
Instructions:
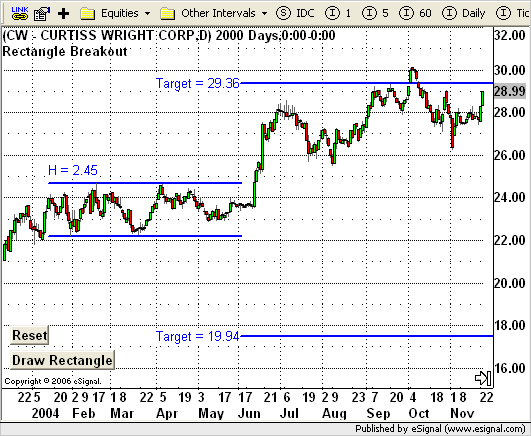
The formula is a drawing tool that will draw the rectangle and calculate the predicted targets based on the algorithm provided in the article. Click on the "Draw Rectangle" button in the lower left corner of the chart. Then double click on the chart where the left side of the rectangle is to begin followed by a double click on the chart for the end of the rectangle period. The upper and lower bounds of the rectangle will then appear with a text label for the height of the rectangle. There will also be a line drawn at the target price level for both a long and short targets. To redraw the rectangle at a different location, click on the "Draw Rectangle" button and repeat the process. To remove the rectangle, click on the "Reset" button.
1 - Click on Draw Rectangle
2 - Double click on chart for beginnng of rectagle.
3 - Double click on chart for end of rectangle.
4 - Click Reset to remove the rectangle.
The related article is copyrighted material. If you are not a subscriber of Stocks & Commodities, please visit www.traders.com.
Download File:
RectangleBO.efs
EFS Code:
Description:
This study is based on the June 2007 article, How Effective are Rectangles, by Markos Katsanos.
Formula Parameters:
Color: blue
Thickness: 2
Notes:
Instructions:
The formula is a drawing tool that will draw the rectangle and calculate the predicted targets based on the algorithm provided in the article. Click on the "Draw Rectangle" button in the lower left corner of the chart. Then double click on the chart where the left side of the rectangle is to begin followed by a double click on the chart for the end of the rectangle period. The upper and lower bounds of the rectangle will then appear with a text label for the height of the rectangle. There will also be a line drawn at the target price level for both a long and short targets. To redraw the rectangle at a different location, click on the "Draw Rectangle" button and repeat the process. To remove the rectangle, click on the "Reset" button.
1 - Click on Draw Rectangle
2 - Double click on chart for beginnng of rectagle.
3 - Double click on chart for end of rectangle.
4 - Click Reset to remove the rectangle.
The related article is copyrighted material. If you are not a subscriber of Stocks & Commodities, please visit www.traders.com.
Download File:
RectangleBO.efs
EFS Code:
PHP Code:
/***************************************

Provided By : eSignal (c) Copyright 2007

Description:  How Effective Are Rectangles?

              by Markos Katsanos


Version 1.0  4/11/2007


Notes:

* June 2007 Issue of Stocks and Commodities Magazine

* Study requires version 8.0 or later.


Instructions:

    1 - Click on Draw Rectangle

    2 - Double click on chart for beginnng of rectagle.

    3 - Double click on chart for end of rectangle.

    4 - Click Reset to remove the rectangle.


Formula Parameters:                     Default:

Color                                   blue

Thickness                               2

****************************************/


function preMain() {

    setPriceStudy(true);

    setStudyTitle("Rectangle Breakout ");

    setShowTitleParameters(false);

    setShowCursorLabel(false);


    var fp1 = new FunctionParameter("cColor", FunctionParameter.COLOR);

        fp1.setName("Color");

        fp1.setDefault(Color.blue);

    var fp2 = new FunctionParameter("nThick", FunctionParameter.NUMBER);

        fp2.setName("Thickness");

        fp2.setDefault(2);

}


// Global Variables

var bVersion  = null;    // Version flag

var bInit     = false;   // Initialization flag

var gColor    = null;

var gThick    = null;


function main(cColor, nThick) {

    if (bVersion == null) bVersion = verify();

    if (bVersion == false) return;


    //Initialization

    if (bInit == false && getCurrentBarIndex() == 0) {

        gColor = cColor;

        gThick = nThick;

        drawButtons();

        nA = getGlobalValue("nA"+getInvokerID());

        nB = getGlobalValue("nB"+getInvokerID());

        drawRectangle();

        bInit = true;

    }


    return;

}


var sLabel = "Draw Rectangle";


function drawButtons() {

    drawTextRelative(5, 20, sLabel+"@URL=EFS:click", null, null,

        Text.RELATIVETOLEFT|Text.RELATIVETOBOTTOM|Text.BOLD|Text.LEFT|Text.BUTTON,

        null, 12, "button1");

    drawTextRelative(5, 45, "Reset@URL=EFS:reset", null, null,

        Text.RELATIVETOLEFT|Text.RELATIVETOBOTTOM|Text.BOLD|Text.LEFT|Text.BUTTON,

        null, 12, "button2");


    return;

}


function reset() {

    removeLine("top");

    removeLine("bottom");

    removeLine("long");

    removeLine("short");

    removeText("h");

    removeText("Lt");

    removeText("St");

    nClick = 0;

    sLabel = "Draw Rectangle";

    drawButtons();

    nA = null;

    nB = null;

    setGlobalValue("nA"+getInvokerID(), nA);

    setGlobalValue("nB"+getInvokerID(), nB);

    Alert.playSound("pop.wav");


    return;

}


var nClick = 0;

var nA = null;

var nB = null;


function click() {

    if (nClick == 0) nClick++;


    if (nClick == 1) {

        sLabel = "Double Click Left Side";

        drawButtons();

    }


    Alert.playSound("click.wav");


    return;

}


function onLButtonDblClk( nBarIndex, nYValue) {

    if (nClick == 1) {

        nA = nBarIndex;

        nClick++;

        sLabel = "Double Click Right Side";

        drawButtons();

    } else if (nClick == 2) {

        nB = nBarIndex;

        nClick = 0;

        sLabel = "Draw Rectangle";

        drawButtons();

        drawRectangle();

        nA = null;

        nB = null;

    }


    //debugPrintln(nA + "   " + nB);


    return;

}


function drawRectangle() {

    if (nA == null || nB == null) return;


    var tempA = nA;

    var tempB = nB;


    if (nB < nA) {

        nA = tempB;

        nB = tempA;

    }


    if (nA > 0) nA = 0;

    if (nB > 0) nB = 0;


    setGlobalValue("nA"+getInvokerID(), nA);

    setGlobalValue("nB"+getInvokerID(), nB);


    var nMax = high(nA);

    var nMin = low(nA);


    var i = Math.max(nA, nB);

    var end = Math.min(nA, nB);

    while (i >= end) {

        nMax = Math.max(high(i), nMax);

        nMin = Math.min(low(i), nMin);

        i--;

    }


    var len = Math.max(20, (Math.abs(nA) - Math.abs(nB)) *5);

    var h = nMax - nMin;

    var b = 2.3 * Math.pow(h, 0.8);


    drawTextRelative(nA, (nMax*1.01), "H = " +(h).toFixed(2), gColor, null, Text.LEFT|Text.BOTTOM, "Arial", 12, "h");

    drawLineRelative(nA, nMax, nB, nMax, PS_SOLID, gThick, gColor, "top");

    drawLineRelative(nA, nMin, nB, nMin, PS_SOLID, gThick, gColor, "bottom");


    drawTextRelative(nB, nMax+b, "Target = " +(nMax+b).toFixed(2), gColor, null, Text.RIGHT|Text.VCENTER, "Arial", 12, "Lt");

    drawLineRelative(nB, nMax+b, nB+len, nMax+b, PS_SOLID, gThick, gColor, "long");

    drawLineRelative(nB, nMin-b, nB+len, nMin-b, PS_SOLID, gThick, gColor, "short");

    drawTextRelative(nB, nMin-b, "Target = " +(nMax-b).toFixed(2), gColor, null, Text.RIGHT|Text.VCENTER, "Arial", 12, "St");


    return;

}


function verify() {

    var b = false;

    if (getBuildNumber() < 779) {

        drawTextAbsolute(5, 35, "This study requires version 8.0 or later.",

            Color.white, Color.blue, Text.RELATIVETOBOTTOM|Text.RELATIVETOLEFT|Text.BOLD|Text.LEFT,

            null, 13, "error");

        drawTextAbsolute(5, 20, "Click HERE to upgrade.@URL=http://www.esignal.com/download/default.asp",

            Color.white, Color.blue, Text.RELATIVETOBOTTOM|Text.RELATIVETOLEFT|Text.BOLD|Text.LEFT,

            null, 13, "upgrade");

        return b;

    } else {

        b = true;

    }


    return b;

}