 Tweet
Tweet
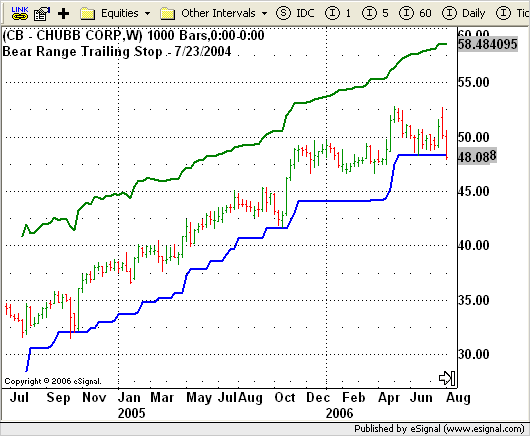
File Name: BearRangeTrailingStop.efs
Description:
This study is based on the January 2008 article, Profit Locking And The Relative Price Channel, by Leon Wilson.
Formula Parameters:
Day of Trend: 19
Month of Trend: 10
Year of Trend: 2007
Bearish Periods: 21
Multiplication Factor: 3.2
Initial Stop: 10
RSI Periods: 34
Notes:
This study requires Daily, Weekly, or Monthly interval. The study requires the Date of the trend to be entered through Edit Studies. The study does not programaticlly determine the start of the trend to be analyzed. The related article is copyrighted material. If you are not a subscriber of Stocks & Commodities, please visit www.traders.com.
Download File:
BearRangeTrailingStop.efs
EFS Code:
PHP Code:
/*********************************

Provided By:

    eSignal (Copyright © eSignal), a division of Interactive Data

    Corporation. 2007. All rights reserved. This sample eSignal

    Formula Script (EFS) is for educational purposes only and may be

    modified and saved under a new file name.  eSignal is not responsible

    for the functionality once modified.  eSignal reserves the right

    to modify and overwrite this EFS file with each new release.


Description:        Profit Locking and The Relative Price Channel

                    by Leon Wilson

Version:            1.0  11/7/2007


Notes:

* January 2008 Issue of Stocks and Commodities Magazine

* Study requires Daily, Weekly, or Monthly interval.

* Study requires version 8.0 or later.

* The study requires the Date of the trend to be entered

    through Edit Studies.  The study does not programaticlly

    determine the start of the trend to be analyzed.


Formula Parameters:                 Defaults:

Day of Trend                        19

Month of Trend                      10

Year of Trend                       2007

Bearish Periods                     21

Multiplication Factor               3.2

Initial Stop                        10

RSI Periods                         34

**********************************/


function preMain() {

    setPriceStudy(true);

    setStudyTitle("Bear Range Trailing Stop ");

    setCursorLabelName("Stop", 0);

    setCursorLabelName("Bullish", 1);

    setDefaultBarFgColor(Color.blue, 0);

    setDefaultBarFgColor(Color.green, 1);

    setDefaultBarThickness(2, 0);

    setDefaultBarThickness(2, 1);

    setShowTitleParameters(false);


    var fp1 = new FunctionParameter("Dy", FunctionParameter.NUMBER);

        fp1.setName("Day of Trend");

        fp1.setLowerLimit(1);

        fp1.setUpperLimit(31);

        fp1.setDefault(19);

    var fp2 = new FunctionParameter("Mn", FunctionParameter.NUMBER);

        fp2.setName("Month of Trend");

        fp2.setLowerLimit(1);

        fp2.setUpperLimit(12);

        fp2.setDefault(10);

    var fp3 = new FunctionParameter("Yr", FunctionParameter.NUMBER);

        fp3.setName("Year of Trend");

        fp3.setLowerLimit(1);

        fp3.setDefault(2007);

    var fp4 = new FunctionParameter("Value1", FunctionParameter.NUMBER);

        fp4.setName("Bearish Periods");

        fp4.setLowerLimit(3);

        fp4.setUpperLimit(55);

        fp4.setDefault(21);

    var fp5 = new FunctionParameter("Value2", FunctionParameter.NUMBER);

        fp5.setName("Multiplication Factor");

        fp5.setLowerLimit(1);

        fp5.setUpperLimit(10);

        fp5.setDefault(3.2);

    var fp6 = new FunctionParameter("Value3", FunctionParameter.NUMBER);

        fp6.setName("Initial Stop");

        fp6.setLowerLimit(0);

        fp6.setUpperLimit(100000);

        fp6.setDefault(10);

    var fp7 = new FunctionParameter("Value4", FunctionParameter.NUMBER);

        fp7.setName("RSI Periods");

        fp7.setLowerLimit(1);

        fp7.setDefault(34);

}


// Global Variables

var bVersion  = null;    // Version flag

var bInit     = false;   // Initialization flag


var xIndex    = null;

var xRangeA   = null;

var xBearish  = null;

var Stop      = null;

var Stop_1    = null;

var nDaysSince = -1;


function main(Dy, Mn, Yr, Value1, Value2, Value3, Value4) {

    var nState = getBarState();

    var nIndex = getCurrentBarIndex();

    if (bVersion == null) bVersion = verify();

    if (bVersion == false) return;


    if (!isDWM()) {

        drawTextPixel(5, 35, "Study requires a D, W, or M interval.", Color.red, Color.lightgrey, Text.RELATIVETOLEFT|Text.RELATIVETOBOTTOM, null, 12, "error0");

        return;

    }


    if (bInit == false) {

        xIndex = rsi(Value4);

        xRangeA = sma(Value1, efsInternal("calcSum", close(), low(), Value1));

        xBearish = efsInternal("calcBearish", Value1);

        setStudyTitle("Bear Range Trailing Stop - " + Mn +"/"+ Dy +"/"+ Yr);

        bInit = true;

    }


    if (xIndex.getValue(0) == null) return;


    var nHoldingDays = BarsSince(Dy, Mn, Yr);


    if (nIndex >= -1 && nHoldingDays == -1) {// Date not found

        drawTextPixel(5, 35, "Date not found in chart data for BarsSince("+Mn+"/"+Dy+"/"+Yr+")", Color.red, Color.lightgrey, Text.RELATIVETOLEFT|Text.RELATIVETOBOTTOM, null, 12, "error1");

        drawTextPixel(5, 15, "Enter new date or extend chart history.", Color.red, Color.lightgrey, Text.RELATIVETOLEFT|Text.RELATIVETOBOTTOM, null, 12, "error2");

        return;

    } else {

        removeText("error1");

        removeText("error2");

    }


    var Value5 = 75;  // OverBought Region

    var OB = xIndex.getValue(0) - Value5;


    if (OB == null) return;


    var Bullish = close(0) - (close(0) * (OB/100));

    var Bearish = xBearish.getValue(0);

    var RangeA = xRangeA.getValue(0);


    if (Bearish == null || RangeA == null) return;


    if (nState == BARSTATE_NEWBAR) {

        if (Stop != null) Stop_1 = Stop;

    }


    if (nHoldingDays >= 0) {

        Stop = close(0) - ((Bearish+RangeA) * Value2 );


        if (Stop > Stop_1 && Stop > Value3) {

            Stop = Stop;

        } else if (Stop > Stop_1 && Stop < Value3) {

            Stop = Value3;

        } else if (Stop <= Stop_1) {

            Stop = Stop_1;

        } else {

            Stop = Stop*nHoldingDays;

        }

    } else {

        return;

    }


    return new Array(Stop_1, Bullish);

}


var xA = null;

var xB = null;


function calcSum(a, b, len) {

    if (xA == null) xA = sma(len, a);

    if (xB == null) xB = sma(len, b);


    var nA = a.getValue(0);

    var nB = b.getValue(0);

    if (nA == null || nB == null) return;


    return (nA-nB);

}


var xC = null;


function calcBearish(len) {

    if (xC == null) xC = sma(len, efsInternal("calcBSrc"));


    var nC = xC.getValue(0);

    if (nC == null) return;


    return nC;

}


function calcBSrc() {

    if (low(-1) == null) return;

    return Math.abs(low(0) - low(-1));

}


function BarsSince(d, m, y) {

    var nRet = -1;


    if (nDaysSince < 0 && day(0) >= d && month(0) >= m && year(0) >= y) {

        nDaysSince = 0;

    } else if (nDaysSince >= 0 && getBarState() == BARSTATE_NEWBAR) {

        nDaysSince++;

    }


    if (nDaysSince >= 0) nRet = nDaysSince;

    return nRet;

}


function verify() {

    var b = false;

    if (getBuildNumber() < 779) {

        drawTextAbsolute(5, 35, "This study requires version 8.0 or later.",

            Color.white, Color.blue, Text.RELATIVETOBOTTOM|Text.RELATIVETOLEFT|Text.BOLD|Text.LEFT,

            null, 13, "error");

        drawTextAbsolute(5, 20, "Click HERE to upgrade.@URL=http://www.esignal.com/download/default.asp",

            Color.white, Color.blue, Text.RELATIVETOBOTTOM|Text.RELATIVETOLEFT|Text.BOLD|Text.LEFT,

            null, 13, "upgrade");

        return b;

    } else {

        b = true;

    }


    return b;

}