 Tweet
Tweet
File Name: RSI_Bands.efs
Description:
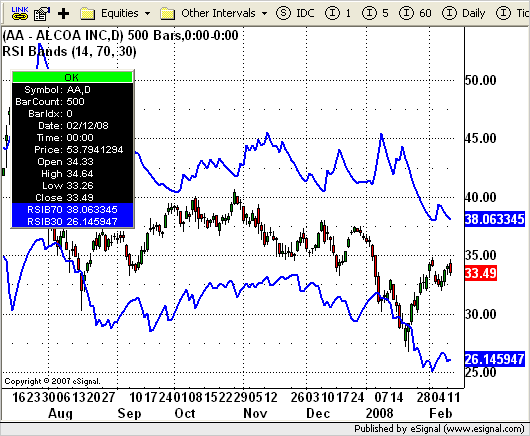
These studies are based on the April 2008 article, RSI Bands, by François Bertrand.
Formula Parameters:
Periods: 14
Upper Band: 70
Lower Band: 30
Band Color: Blue
Band Thickness: 2
Enable Clamping: false
Notes:
The related article is copyrighted material. If you are not a subscriber of Stocks & Commodities, please visit www.traders.com.
Download File:
RSI_Bands.efs
EFS Code:
Description:
These studies are based on the April 2008 article, RSI Bands, by François Bertrand.
Formula Parameters:
Periods: 14
Upper Band: 70
Lower Band: 30
Band Color: Blue
Band Thickness: 2
Enable Clamping: false
Notes:
The related article is copyrighted material. If you are not a subscriber of Stocks & Commodities, please visit www.traders.com.
Download File:
RSI_Bands.efs
EFS Code:
PHP Code:
/*********************************

Provided By:

    eSignal (Copyright © eSignal), a division of Interactive Data

    Corporation. 2007. All rights reserved. This sample eSignal

    Formula Script (EFS) is for educational purposes only and may be

    modified and saved under a new file name.  eSignal is not responsible

    for the functionality once modified.  eSignal reserves the right

    to modify and overwrite this EFS file with each new release.


Description:        RSI Bands

                    by François Bertrand


Version:            1.0  2/5/2008


Notes:

* April 2008 Issue of Stocks and Commodities Magazine

* Study requires version 8.0 or later.


Formula Parameters:                 Defaults:

Periods                             14

Upper Band                          70

Lower Band                          30

Band Color                          Blue

Band Thickness                      2

Enable Clamping                     false

**********************************/


function preMain() {

    setPriceStudy(true);

    setStudyTitle("RSI Bands ");

    setCursorLabelName("RSIB70", 0);

    setCursorLabelName("RSIB30", 1);

    setShowTitleParameters(false);


    var fp1 = new FunctionParameter("nPeriods", FunctionParameter.NUMBER);

        fp1.setName("Periods");

        fp1.setLowerLimit(0);

        fp1.setDefault(14);

    var fp2 = new FunctionParameter("nUpper", FunctionParameter.NUMBER);

        fp2.setName("Upper Band");

        fp2.setLowerLimit(0);

        fp2.setDefault(70);

    var fp3 = new FunctionParameter("nLower", FunctionParameter.NUMBER);

        fp3.setName("Lower Band");

        fp3.setLowerLimit(0);

        fp3.setDefault(30);

    var fp4 = new FunctionParameter("cColor", FunctionParameter.COLOR);

        fp4.setName("Band Color");

        fp4.setDefault(Color.blue);

    var fp5 = new FunctionParameter("nThick", FunctionParameter.NUMBER);

        fp5.setName("Band Thickness");

        fp5.setLowerLimit(1);

        fp5.setDefault(2);

    var fp6 = new FunctionParameter("bClamp", FunctionParameter.BOOLEAN);

        fp6.setName("Enable Clamping");

        fp6.setDefault(false);

}


// Global Variables

var bVersion  = null;    // Version flag

var bInit     = false;   // Initialization flag


var xUpperRSI = null;

var xLowerRSI = null;


function main(nPeriods, nUpper, nLower, cColor, nThick, bClamp) {

    var nState = getBarState();

    var nIndex = getCurrentBarIndex();

    if (bVersion == null) bVersion = verify();

    if (bVersion == false) return;


    if (bInit == false) {

        setStudyTitle("RSI Bands (" + nPeriods + ", " + nUpper + ", " + nLower + ")");

        setCursorLabelName("RSIB"+nUpper, 0);

        setCursorLabelName("RSIB"+nLower, 1);

        setDefaultBarFgColor(cColor, 0);

        setDefaultBarFgColor(cColor, 1);

        setDefaultBarThickness(nThick, 0);

        setDefaultBarThickness(nThick, 1);


        xUpperRSI = efsInternal("RSI_Band", nPeriods, nUpper, bClamp );

        xLowerRSI = efsInternal("RSI_Band", nPeriods, nLower, bClamp );


        bInit = true;

    }


    var nUpperRSI = xUpperRSI.getValue(0);

    var nLowerRSI = xLowerRSI.getValue(0);

    if (nUpperRSI == null || nLowerRSI == null) return;


    return new Array(nUpperRSI, nLowerRSI);

}


var result = null;

var result_1 = null;

var P = 0;

var N = 0;

var P_1 = 0;

var N_1 = 0;


function RSI_Band( period, TargetRSILevel, clamp ) {

    var diff = null;

    var HypotheticalCloseToMatchRSITarget = 0;

    var nState = getBarState();


    if (nState == BARSTATE_NEWBAR) {

        result_1 = result;

        P_1 = P;

        N_1 = N;

    }


    if (close(-period) == null) return;


    var W = 0;

    var S = 0;

    var diff = close(0) - close(-1);

    if( diff > 0 ) W = diff;

    if( diff < 0 ) S = -diff;

    // Compute the hypothetical price close to reach the target RSI level

    // based on yesterday’s RSI and close

    // Depending on if we would need the price to increase or decrease,

    // we use a different formula

    if (result_1 != null && result_1 > close(-1)) {

        HypotheticalCloseToMatchRSITarget = close(-1)+P_1-P_1*period-((N_1*period)-N_1)*TargetRSILevel /(TargetRSILevel - 100);

    } else {

        HypotheticalCloseToMatchRSITarget = close(-1)-N_1-P_1+N_1*period+P_1*period+(100*P_1)/TargetRSILevel -(100*P_1*period)/TargetRSILevel;

    }


    if (clamp == true) {

        // Optional clamping code

        // Enable the clamping option in Edit Studies if parameters used cause too much volatility.

        // (generally caused by using a very short period) This will keep the RSI Bands

        // within roughly 10% of the price

        if ( (HypotheticalCloseToMatchRSITarget - close(-1)) > 0.1*close(-1)) {

            HypotheticalCloseToMatchRSITarget = close(-1)*1.1;

        } else if ( (HypotheticalCloseToMatchRSITarget - close(-1)) < -0.1*close(-1)) {

            HypotheticalCloseToMatchRSITarget = close(-1)*0.9;

        }

        // Resume standard RSI code to update the running P and N averages

    }


    P = ( ( period -1 ) * P_1 + W ) / period;

    N = ( ( period -1 ) * N_1 + S ) / period;


    if (getCurrentBarCount() >= period) {

        result = HypotheticalCloseToMatchRSITarget;

        return result;

    } else {

        return null;

    }

}


function verify() {

    var b = false;

    if (getBuildNumber() < 779) {

        drawTextAbsolute(5, 35, "This study requires version 8.0 or later.",

            Color.white, Color.blue, Text.RELATIVETOBOTTOM|Text.RELATIVETOLEFT|Text.BOLD|Text.LEFT,

            null, 13, "error");

        drawTextAbsolute(5, 20, "Click HERE to upgrade.@URL=http://www.esignal.com/download/default.asp",

            Color.white, Color.blue, Text.RELATIVETOBOTTOM|Text.RELATIVETOLEFT|Text.BOLD|Text.LEFT,

            null, 13, "upgrade");

        return b;

    } else {

        b = true;

    }


    return b;

}