Description:
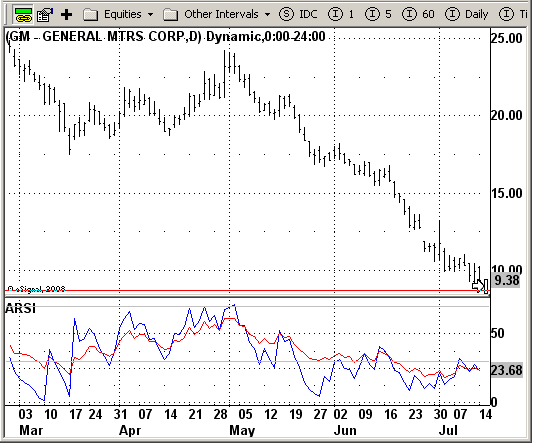
The following study is based on the October 2008 article, ARSI, The Asymmetrical RSI, by Sylvain Vervoort.
Formula Parameters:
Period: 14
Upper Band: 70
Lower Band: 30
ARSI Color: Blue
RSI Color: Red
Show Parameters: False
Notes:
The related article is copyrighted material. If you are not a subscriber of Stocks & Commodities, please visit www.traders.com.
Download File:
ARSI.efs
EFS Code:
PHP Code:
/*********************************

Provided By:

    eSignal (Copyright c eSignal), a division of Interactive Data

    Corporation. 2008. All rights reserved. This sample eSignal

    Formula Script (EFS) is for educational purposes only and may be

    modified and saved under a new file name.  eSignal is not responsible

    for the functionality once modified.  eSignal reserves the right

    to modify and overwrite this EFS file with each new release.


Description:

    ARSI, The Asymmetrical RSI by Sylvain Vervoort


Version:            1.0  08/07/2008


Notes:

    October 2008 issue of Stocks & Commodities Magazine


Formula Parameters:                     Default:

    Period                               14

    Upper Band                           70

    Lower Band                           30

    ARSI Color                           Blue

    RSI Color                            Red

    Show Parameters                      False

**********************************/


var fpArray = new Array();


function preMain() {

    setPriceStudy(false);

    setStudyTitle("ARSI ");

    setCursorLabelName("ARSI", 0);

    setCursorLabelName("RSI", 1);


    setDefaultBarFgColor(Color.blue, 0);

    setDefaultBarFgColor(Color.red, 1);


    setPlotType(PLOTTYPE_LINE, 0);

    setPlotType(PLOTTYPE_LINE, 1);


    setDefaultBarThickness(1, 0);

    setDefaultBarThickness(1, 1);


    askForInput();


    var x=0;

    fpArray[x] = new FunctionParameter("Period", FunctionParameter.NUMBER);

    with(fpArray[x++]){

        setName("Period");

        setLowerLimit(1);

        setUpperLimit(100);

        setDefault(14);

    }


    fpArray[x] = new FunctionParameter("Color1", FunctionParameter.COLOR);

    with(fpArray[x++]){

        setName("ARSI Color");

        setDefault(Color.blue);

    }


    fpArray[x] = new FunctionParameter("Color2", FunctionParameter.COLOR);

    with(fpArray[x++]){

        setName("RSI Color");

        setDefault(Color.red);

    }


    fpArray[x] = new FunctionParameter("Upper", FunctionParameter.NUMBER);

    with(fpArray[x++]){

        setName("Upper Band");

        setLowerLimit(0);

        setDefault(70);

    }


    fpArray[x] = new FunctionParameter("Lower", FunctionParameter.NUMBER);

    with(fpArray[x++]){

        setName("Lower Band");

        setLowerLimit(0);

        setDefault(30);

    }


    fpArray[x] = new FunctionParameter("ShowParam", FunctionParameter.BOOLEAN);

    with(fpArray[x++]){

       setName("Show Parameters");

       setDefault(false);

    }


}


var xSum1 = null

var xSum2 = null;

var xSum3 = null;

var xSum4 = null;

var xRSI  = null;

var bInit = false;

var bVersion = null;


function main(Period, Upper, Lower, Color1, Color2, ShowParam){


    if (bVersion == null) bVersion = verify();

    if (bVersion == false) return;

    if(getCurrentBarCount()<Period) return;


    if(bInit==false){

        xSum1 = efsInternal("Sum",Period);

        xSum2 = getSeries(xSum1,1);

        xSum3 = getSeries(xSum1,2);

        xSum4 = getSeries(xSum1,3);

        xRSI = rsi(Period);

        addBand(Upper,PS_SOLID,1,Color.grey,"UpperBand");

        addBand(Lower,PS_SOLID,1,Color.grey,"LowerBand");

        setShowTitleParameters( ShowParam );

        bInit=true;

    }


    var xUpMoveAvg = ema((xSum1.getValue(0)*2)-1,xSum3);

    var xDnMoveAvg = ema((xSum2.getValue(0)*2)-1,xSum4);


    if(xUpMoveAvg==null||xDnMoveAvg==null) return;


    var RS = xUpMoveAvg.getValue(0)/xDnMoveAvg.getValue(0);

    var nRSI = xRSI.getValue(0);

    if(nRSI==null) return;


    return new Array (100-(100/(1+RS)),nRSI)

}


var xMom = null;

var xInit = false;


function Sum(Period){


    if(xInit==false){

        xMom = mom(1);

        xInit = true;

    }


    var nSum = 0;

    for(var i = 0; i < Period; i++){

        if(xMom.getValue(-i) >= 0) {

            nSum += 1;

        }

    }


    var UpCount = nSum;

    var DnCount = Period-UpCount;

    var UpMove = xMom.getValue(0)>=0?xMom.getValue(0):0;

    var DnMove = xMom.getValue(0)<0?Math.abs(xMom.getValue(0)):0;


    return new Array(UpCount,DnCount,UpMove,DnMove);

}


function verify() {

    var b = false;

    if (getBuildNumber() < 779) {

        drawTextAbsolute(5, 35, "This study requires version 8.0 or later.",

            Color.white, Color.blue, Text.RELATIVETOBOTTOM|Text.RELATIVETOLEFT|Text.BOLD|Text.LEFT,

            null, 13, "error");

        drawTextAbsolute(5, 20, "Click HERE to upgrade.@URL=http://www.esignal.com/download/default.asp",

            Color.white, Color.blue, Text.RELATIVETOBOTTOM|Text.RELATIVETOLEFT|Text.BOLD|Text.LEFT,

            null, 13, "upgrade");

        return b;

    } else {

        b = true;

    }

    return b;

}