 Tweet
Tweet
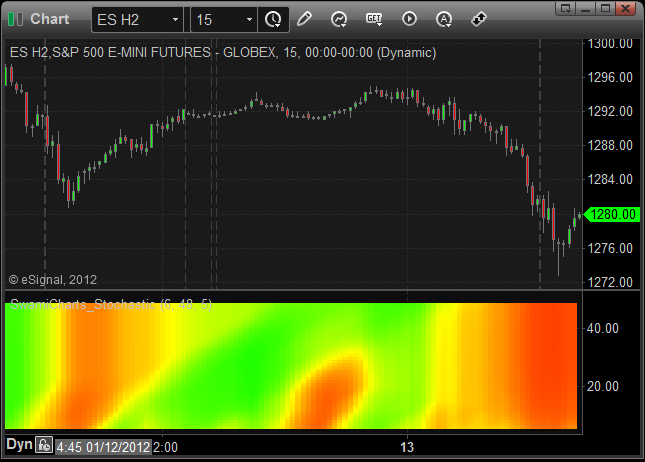
File Name: SwamiCharts_Stochastic.efs
Description:
Introducing SwamiCharts by John Ehlers and Ric Way.
Formula Parameters:
SwamiCharts_Stochastic.efs
Fastest Period: 6
Lowest Period: 48
Line Thickness: 5
Notes:
The related article is copyrighted material. If you are not a subscriber
of Stocks & Commodities, please visit www.traders.com.
Download File:
SwamiCharts_Stochastic.efs
SwamiCharts_Stochastic.efs
EFS Code:
PHP Code:
/*********************************
Provided By:
Interactive Data Corporation (Copyright © 2012)
All rights reserved. This sample eSignal Formula Script (EFS)
is for educational purposes only. Interactive Data Corporation
reserves the right to modify and overwrite this EFS file with
each new release.
Description:
Introducing SwamiCharts by John Ehlers
Version: 2.00 17/02/2012
Formula Parameters: Default:
Fastest Period 6
Lowest Period 48
Line Thickness 5
Notes:
The related article is copyrighted material. If you are not a subscriber
of Stocks & Commodities, please visit [url]www.traders.com.[/url]
**********************************/
var fpArray = new Array();
function preMain () {
setStudyTitle("SwamiCharts_Stochastic");
setShowCursorLabel(false);
setComputeOnClose(true);
var x=0;
fpArray[x] = new FunctionParameter("fastPeriod", FunctionParameter.NUMBER);
with(fpArray[x++])
{
setName("Fastest Period");
setLowerLimit(1);
setUpperLimit(20);
setDefault(6);
}
fpArray[x] = new FunctionParameter("slowPeriod", FunctionParameter.NUMBER);
with(fpArray[x++])
{
setName("Lowest Period");
setLowerLimit(40);
setUpperLimit(100);
setDefault(48);
}
fpArray[x] = new FunctionParameter("lineThickness", FunctionParameter.NUMBER);
with(fpArray[x++])
{
setName("Line Thickness");
setLowerLimit(1);
setUpperLimit(20);
setDefault(5);
}
}
var bInit = false;
var bVersion = null;
var resArray = null;
var xhhArray = null;
var xllArray = null;
var numArray = null;
var denomArray = null;
var stochArray = null;
function main (fastPeriod, slowPeriod, lineThickness)
{
if (bVersion == null) bVersion = verify();
if (bVersion == false) return;
if (!bInit)
{
resArray = new Array();
xhhArray = new Array();
xllArray = new Array();
numArray = new Array();
denomArray = new Array();
stochArray = new Array();
for (var i = fastPeriod; i <= slowPeriod; i++)
{
resArray.push(i);
xhhArray.push(hhv(i, high()));
xllArray.push(llv(i, low()));
numArray.push(0);
denomArray.push(0);
stochArray.push(0);
setDefaultBarThickness(lineThickness, i - fastPeriod);
}
bInit = true;
}
for (var i = 0; i <= slowPeriod - fastPeriod; i++)
{
var vhh = xhhArray[i].getValue(0);
var vll = xllArray[i].getValue(0);
if (vhh == null || vll == null)
return;
numArray[i] = (close(0) - vll + numArray[i]) / 2;
denomArray[i] = (vhh - vll + denomArray[i]) / 2;
if (denomArray[i] != 0)
stochArray[i] = 0.2 * (numArray[i] / denomArray[i]) + 0.8 * stochArray[i];
var colorR = 255;
var colorG = 255;
var colorB = 0;
if (stochArray[i] > 0.5)
{
colorR = Math.floor(255 * (2 - 2 * stochArray[i]));
}
else
{
colorG = Math.floor(255 * 2 * stochArray[i]);
}
setBarFgColor(Color.RGB(colorR, colorG, colorB), i);
}
return resArray;
}
// verify version
function verify() {
var b = false;
if (getBuildNumber() < 779) {
drawTextAbsolute(5, 35, "This study requires version 8.0 or later.",
Color.white, Color.blue, Text.RELATIVETOBOTTOM|Text.RELATIVETOLEFT|Text.BOLD|Text.LEFT,
null, 13, "error");
drawTextAbsolute(5, 20, "Click HERE to upgrade.@URL=http://www.esignal.com/download/default.asp",
Color.white, Color.blue, Text.RELATIVETOBOTTOM|Text.RELATIVETOLEFT|Text.BOLD|Text.LEFT,
null, 13, "upgrade");
return b;
} else {
b = true;
}
return b;
}