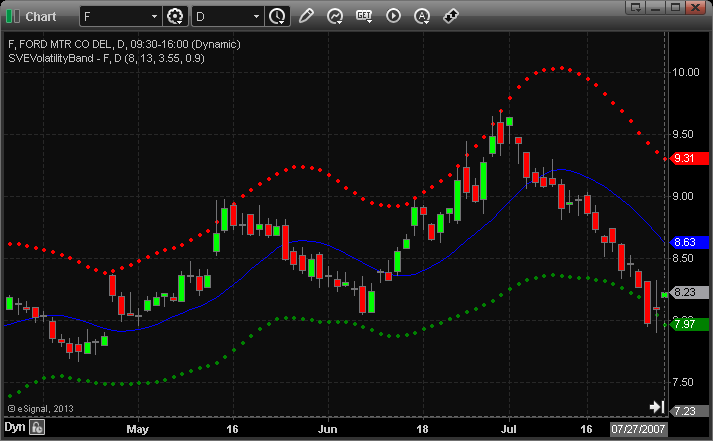
File Name: SVEVolatilityBand.efs
Description:
Within the Volatility Band by Sylvain Vervoort
Formula Parameters:
SVEVolatilityBand.efs
Band Average 8
Summing Period 13
Deviation Factor 3.55
Lower Band Adjust 0.9
Notes:
The related article is copyrighted material. If you are not a subscriber
of Stocks & Commodities, please visit www.traders.com.
Download File:
SVEVolatilityBand.efs
SVEVolatilityBand.efs

EFS Code:
Description:
Within the Volatility Band by Sylvain Vervoort
Formula Parameters:
SVEVolatilityBand.efs
Band Average 8
Summing Period 13
Deviation Factor 3.55
Lower Band Adjust 0.9
Notes:
The related article is copyrighted material. If you are not a subscriber
of Stocks & Commodities, please visit www.traders.com.
Download File:
SVEVolatilityBand.efs
SVEVolatilityBand.efs

EFS Code:
PHP Code:
/*********************************
Provided By:
    Interactive Data Corporation (Copyright © 2013)
    All rights reserved. This sample eSignal Formula Script (EFS)
    is for educational purposes only. Interactive Data Corporation
    reserves the right to modify and overwrite this EFS file with
    each new release.

Description:
    Within the Volatility Band by Sylvain Vervoort

Version:            1.00  06/06/2013

Formula Parameters:                     Default:
Band Average                            8
Summing Period                          13
Deviation Factor                        3.55
Lower Band Adjust                       0.9

Notes:
    The related article is copyrighted material. If you are not a subscriber
    of Stocks & Commodities, please visit www.traders.com.

**********************************/


var fpArray = new Array();

function preMain()
{
    setPriceStudy(true);
    setStudyTitle("SVEVolatilityBand");

    setCursorLabelName("Upper", 0);
    setCursorLabelName("Median", 1);
    setCursorLabelName("Lover", 2);

    setDefaultBarFgColor(Color.blue, 1);
    setDefaultBarFgColor(Color.red, 0);
    setDefaultBarFgColor(Color.green, 2);

    setPlotType(PLOTTYPE_DOT, 0);
    setPlotType(PLOTTYPE_LINE, 1);
    setPlotType(PLOTTYPE_DOT, 2);

    setDefaultBarThickness(2, 0);
    setDefaultBarThickness(1, 1);
    setDefaultBarThickness(2, 2);

    var x = 0;

    fpArray[x] = new FunctionParameter("fpBandAverage", FunctionParameter.NUMBER);
    with(fpArray[x++])
    {
        setName("Band Average");
        setLowerLimit(1);
        setDefault(8);
    }

    fpArray[x] = new FunctionParameter("fpSummingPeriod", FunctionParameter.NUMBER);
    with(fpArray[x++])
    {
        setName( "Summing Period" );
        setLowerLimit(1);
        setDefault(13);
    }

    fpArray[x] = new FunctionParameter("fpDeviationFactor", FunctionParameter.NUMBER);
    with(fpArray[x++])
    {
        setName( "Deviation Factor" );
        setDefault(3.55);
    }

    fpArray[x] = new FunctionParameter("fpLowerBandAdjust", FunctionParameter.NUMBER);
    with(fpArray[x++])
    {
        setName( "Lower Band Adjust" );
        setDefault(0.9);
    }
}

var bInit = false;
var bVersion = null;

var xHLC3 = null;
var xLow = null;

var xTypical = null;
var xDeviation = null;
var xDev = null;

var xMedianAverage = null;
var xMedianEMA = null;
var xMedianSMA = null;

function main(fpBandAverage, fpSummingPeriod, fpDeviationFactor, fpLowerBandAdjust)
{
    if (bVersion == null) bVersion = verify();
    if (bVersion == false) return;

    if (!bInit)
    {
        xHLC3 = hlc3();
        xLow  = low();

        xTypical = efsInternal("Calc_TypicalSeries", xHLC3, xLow);
        xDeviation = efsInternal("Calc_DeviationSeries", xTypical, fpSummingPeriod, fpDeviationFactor);
        xDev = ema(fpBandAverage, xDeviation);

        xMedianAverage = ema(fpBandAverage, xHLC3);
        xMedianEMA = ema(fpBandAverage, xMedianAverage);
        xMedianSMA = sma(fpBandAverage, xMedianAverage);

        bInit = true;
    }

    var nDev = xDev.getValue(0);

    if (nDev == null)
        return;

    var nDevHigh = nDev;
    var nDevLow = nDev * fpLowerBandAdjust;

    var nMedianEMA = xMedianEMA.getValue(0);
    var nMedianSMA = xMedianSMA.getValue(0);

    if (nMedianEMA == null || nMedianSMA == null)
        return;

    var nUpper = nMedianEMA + nDevHigh;
    var nLower = nMedianEMA - nDevLow;
    var nMedian = nMedianSMA;

    return [nUpper, nMedian, nLower];
}

function Calc_TypicalSeries(xHLC3, xLow)
{
    var nReturnValue = 0;

    var nHLC3 = xHLC3.getValue(0);
    var nHLC3_1 = xHLC3.getValue(-1);
    var nLow = xLow.getValue(0);
    var nLow_1 = xLow.getValue(-1);

    if(nHLC3_1 == null || nLow_1 == null)
        return;

    if (nHLC3 >= nHLC3_1)
        nReturnValue = nHLC3 - nLow_1;
    else
        nReturnValue = nHLC3_1 - nLow;

    return nReturnValue;
}


var xSMA = null;

function Calc_DeviationSeries(xSeries, nSummingPeriod, nDeviationFactor)
{
    if (getBarState() == BARSTATE_ALLBARS)
    {
        xSMA = sma(nSummingPeriod, xSeries);
    }

    var nSMA = xSMA.getValue(0);

    if (nSMA == null)
        return;

    return nSMA * nDeviationFactor;
}

function verify()
{
    var b = false;
    if (getBuildNumber() < 779)
    {
        drawTextAbsolute(5, 35, "This study requires version 8.0 or later.",
            Color.white, Color.blue, Text.RELATIVETOBOTTOM|Text.RELATIVETOLEFT|Text.BOLD|Text.LEFT,
            null, 13, "error");
        drawTextAbsolute(5, 20, "Click HERE to upgrade.@URL=http://www.esignal.com/download/default.asp",
            Color.white, Color.blue, Text.RELATIVETOBOTTOM|Text.RELATIVETOLEFT|Text.BOLD|Text.LEFT,
            null, 13, "upgrade");
        return b;
    }
    else
    {
        b = true;
    }

    return b;
}