 Tweet
Tweet
File Name: eSignal_RisingDarkness.efs
Description:
Based on Trading In The Hours Of Darkness – Holding Overnight Positions by Anthony Trongone, PhD, CFP, CTA. This article appeared in the January 2004 issue of Stocks & Commodities.
Formula Parameters:
None.
Notes:
The related article is copyrighted material. If you are not a subscriber of Stocks & Commodities, please visit www.traders.com.
Download File:
eSignal_RisingDarkness.efs
EFS Code:
PHP Code:
/********************************************
Provided By : eSignal. (c) Copyright 2003
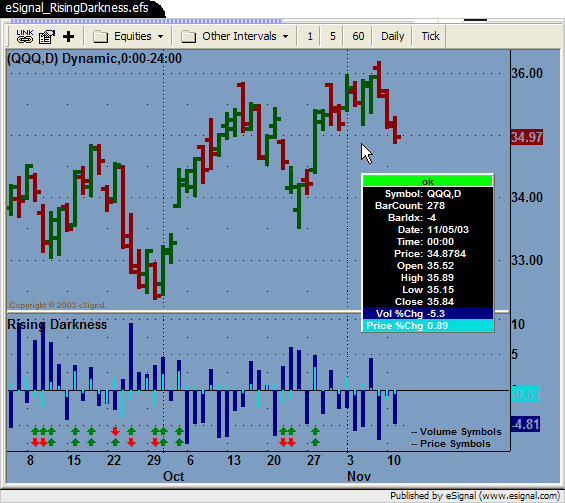
Indicator: Rising Darkness
Notes:
Requires at least 50 bars of data and a
Daily chart interval.
Bottom row of arrows are Price symbols.
Top row of arrows are Volume symbols.
********************************************/
function preMain() {
setStudyTitle("Rising Darkness ");
setCursorLabelName("Vol \%Chg", 0);
setCursorLabelName("Price \%Chg", 1);
setDefaultBarThickness(5, 0);
setDefaultBarThickness(3, 1);
setDefaultBarFgColor(Color.navy, 0);
setDefaultBarFgColor(Color.aqua, 1);
setPlotType(PLOTTYPE_HISTOGRAM, 0);
setPlotType(PLOTTYPE_HISTOGRAM, 1);
addBand(0, PS_SOLID, 1, Color.black, "zero");
}
var aVolChg = new Array(50);
var aVol = new Array(8);
var vVol = null; // Today's volume
var vAvg = null; // Today's avg volume
var vAvg1 = null; // Yesterday's avg volume
var vVolChg = null;
var bLabels = false;
var nImageCntr = 0;
function main() {
if (getInterval() != "D") {
drawTextAbsolute(-1, 10, "Formula requires Daily interval.",
Color.red, Color.black, Text.BOLD|Text.RIGHT, null,
12, "error");
return;
}
// Remove the code block above to enable all intervals.
if (bLabels == false) {
drawTextAbsolute(2, 2, "-- Price Symbols", Color.black,
null, Text.BOLD|Text.RELATIVETOBOTTOM, null,
10, "price label");
drawTextAbsolute(2, 14, "-- Volume Symbols", Color.black,
null, Text.BOLD|Text.RELATIVETOBOTTOM, null,
10, "volume label");
bLabels = true;
}
var nState = getBarState();
var vRank = null;
var c = close();
var c1 = close(-1);
if (c1 == null) return;
if (nState == BARSTATE_NEWBAR && vVol != null) {
nImageCntr += 1;
if (nImageCntr > 200) nImageCntr = 0;
aVol.pop();
aVol.unshift(vVol);
vAvg1 = vAvg;
if (vVolChg != null) {
aVolChg.pop();
aVolChg.unshift(vVolChg);
}
}
vVol = volume();
aVol[0] = vVol;
if (aVol[7] == null) return;
vAvg = calcMA();
if (vAvg1 == null) return;
vVolChg = (((vAvg - vAvg1) / vAvg1) * 100).toFixed(4) *1;
aVolChg[0] = vVolChg;
if (aVolChg[49] != null) {
vRank = getRank(aVolChg);
}
var vPriceChg = (((c - c1) / c) * 100).toFixed(2) *1;
// Draw Volume and Price Symbols
var nVol = 0; // 0 = no signal, 1 = positive, 2 = negative
var nPrc = 0;
if (vRank/50 >= 0.70) {
nVol = 1;
} else if (vRank/50 <= 0.30) {
nVol = 2;
}
if (vPriceChg >= 1.00) {
nPrc = 1;
} else if (vPriceChg <= -1.00) {
nPrc = 2;
}
if (nVol > 0 && nPrc > 0) {
if (nVol == 1) {
drawShapeRelative(0, 12, Shape.UPARROW, null,
Color.green, Shape.RELATIVETOBOTTOM,
"vol"+nImageCntr);
} else if (nVol == 2) {
drawShapeRelative(0, 12, Shape.DOWNARROW, null,
Color.red, Shape.RELATIVETOBOTTOM,
"vol"+nImageCntr);
}
if (nPrc == 1) {
drawShapeRelative(0, 1, Shape.UPARROW, null,
Color.green, Shape.RELATIVETOBOTTOM,
"prc"+nImageCntr);
} else if (nPrc == 2) {
drawShapeRelative(0, 1, Shape.DOWNARROW, null,
Color.red, Shape.RELATIVETOBOTTOM,
"prc"+nImageCntr);
}
} else {
removeShape("vol"+nImageCntr);
removeShape("prc"+nImageCntr);
}
return new Array(vVolChg, vPriceChg);
}
/*** Functions ***/
function calcMA() {
var dSum = 0.0;
var i = 0;
for(i = 0; i < 8; i++) {
dSum += aVol[i];
}
return (dSum / 8);
}
function getRank(aRank) {
var i = 0;
var cntr = 0;
for (i = 0; i < 50; ++i) {
if (vVolChg >= aRank[i]) cntr += 1;
}
return cntr;
}