 Tweet
Tweet
File Name: fisher.efs
Description:
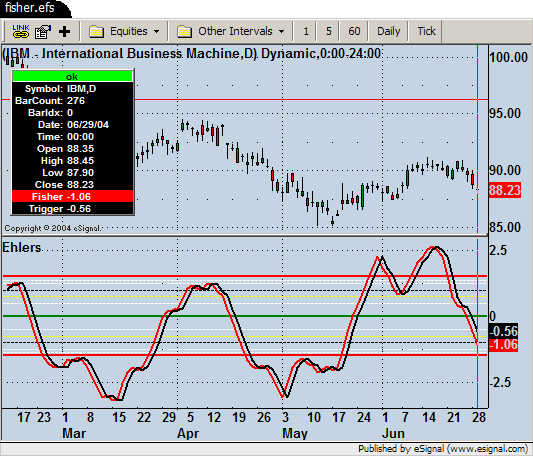
Using The Fisher Transform", John Ehlers, 11/2002, Stocks & Commodities magazine.
Formula Parameters:
Length: 9
Notes:
Fisher Transform assumes that while prices do not have a normal or Gaussian probability density function
(the "bell-shaped curve"), you can create a nearly Gaussian probability density function by normalizing price
(or an indicator such as RSI) and applying the Fisher Transform.
The signal line is the same indicator shifted back N periods. Fisher Transform has distinct turning points
and a rapid response time. Use the peak swings to clearly identify price reversals.
The related article is copyrighted material. If you are not a subscriber of Stocks & Commodities, please visit www.traders.com.
Download File:
fisher.efs
EFS Code:
Description:
Using The Fisher Transform", John Ehlers, 11/2002, Stocks & Commodities magazine.
Formula Parameters:
Length: 9
Notes:
Fisher Transform assumes that while prices do not have a normal or Gaussian probability density function
(the "bell-shaped curve"), you can create a nearly Gaussian probability density function by normalizing price
(or an indicator such as RSI) and applying the Fisher Transform.
The signal line is the same indicator shifted back N periods. Fisher Transform has distinct turning points
and a rapid response time. Use the peak swings to clearly identify price reversals.
The related article is copyrighted material. If you are not a subscriber of Stocks & Commodities, please visit www.traders.com.
Download File:
fisher.efs
EFS Code:
PHP Code:
/* ********************************************************

Copyright © eSignal, a division of Interactive Data Corporation. 2002. All rights reserved.

This sample eSignal Formula Script (EFS) was created for use by authorized eSignal users and

eSignal is not responsible for the functionality or results of this formula. Neither eSignal

nor its employees or affiliates recommend any specific approach to investing in securities


please include this and/or any other comment blocks and a description of any changes you make.

********************************************************* */

/*  Description: "Using The Fisher Transform", John Ehlers, 11/2002, Stocks & Commodities magazine


Fisher Transform assumes that while prices do not have a normal or Gaussian probability density function

(the "bell-shaped curve"), you can create a nearly Gaussian probability density function by normalizing price

(or an indicator such as RSI) and applying the Fisher Transform.


The signal line is the same indicator shifted back N periods. Fisher Transform has distinct turning points

and a rapid response time. Use the peak swings to clearly identify price reversals.*/

/*=====================================================================

Fix History:


11/19/2002  - eSignal_Todd

unknown - previously modified to look like Tradestation version


6/13/2004 -   S.Hare (aka stevehare2003) [email][email protected][/email]

Fixed divide by zero error and added FunctionParameter functionality


=====================================================================*/


addBand(1.5, PS_SOLID, 2, Color.red, "1.5");

addBand(1.38, PS_DASH, 1, Color.white, "1.38");

addBand(1.25, PS_DASH, 1, Color.white, "1.25");

addBand(1, PS_DASH, 1, Color.black, "1");

addBand(.75, PS_DASH, 1, Color.yellow, ".75");

addBand(.5, PS_DASH, 1, Color.white, ".5");

addBand(0, PS_SOLID, 2, Color.green, "0");

addBand(-.5, PS_DASH, 1, Color.white, "-.5");

addBand(-.75, PS_DASH, 1, Color.yellow, "-.75");

addBand(-1, PS_DASH, 1, Color.black, "-1");

addBand(-1.25, PS_DASH, 1, Color.white, "-1.25");

addBand(-1.38, PS_DASH, 1, Color.white, "-1.38");

addBand(-1.5, PS_SOLID, 2, Color.red, "-1.5");


function preMain(){

    setStudyTitle("Ehlers");

    setCursorLabelName("Fisher", 0);

    setCursorLabelName("Trigger", 1);

    setDefaultBarFgColor(Color.red, 0);

    setDefaultBarFgColor(Color.black, 1);


    var fp01 = new FunctionParameter("Len", FunctionParameter.NUMBER);

    fp01.setName("Length");

    fp01.setLowerLimit(5);

    fp01.setDefault(9);


}

var Fish = 0;

var Fish_1 = 0;

var Value1 = 0;

var Value1_1 = 0;


function main(Len) {

    if (Len == null)

        Len = 9;


    if(getBarState() == BARSTATE_NEWBAR) {


        Fish_1 = Fish;

        Value1_1 = Value1;

    }


    var Price = (high() + low()) / 2;

    var Pricei= (high() + low()) / 2;//added this variable

    var MaxH = 0;

    var MinL = 0;

    var i;

    setBarThickness(2,0);

    setBarThickness(2,1);

    for(i = 0; i < Len; i++) {

        Pricei = (high(-i) + low(-i)) / 2; //added this line

        if(i == 0){

            MaxH = Pricei;//changed from: MaxH = high()

            MinL = Pricei;//changed from: MaxH = low()

        }

        else{

            MaxH = Math.max(MaxH, Pricei);//changed from: MaxH = Math.max(MaxH, high(-i))

            MinL = Math.min(MinL, Pricei);//changed from: MinL = Math.min(MinL, low(-i))

        }

    }


    var num1 = (MaxH - MinL);

    if (num1 <.001)

        num1 = .001;

    Value1 = .33 * 2 * ((Price - MinL) / (num1) - .5) + .67 * Value1_1;


    if(Value1 > .99)

        Value1 = .999;

    if(Value1 < -.99)

        Value1 = -.999;

    var num2 = (1 - Value1);

    if (num2 <.001)

        num2 = .001;

    Fish = .5 * Math.log((1 + Value1) / num2) + .5 * Fish_1;


    return new Array(Fish,Fish_1);//removed the redundant temp variable, use Fish_1 instead

}