Announcement

Collapse
No announcement yet.

3 Point Break Chart

Collapse
X
 
  • Filter
  • Time
  • Show
Clear All
new posts

  • 3 Point Break Chart

    Hello,
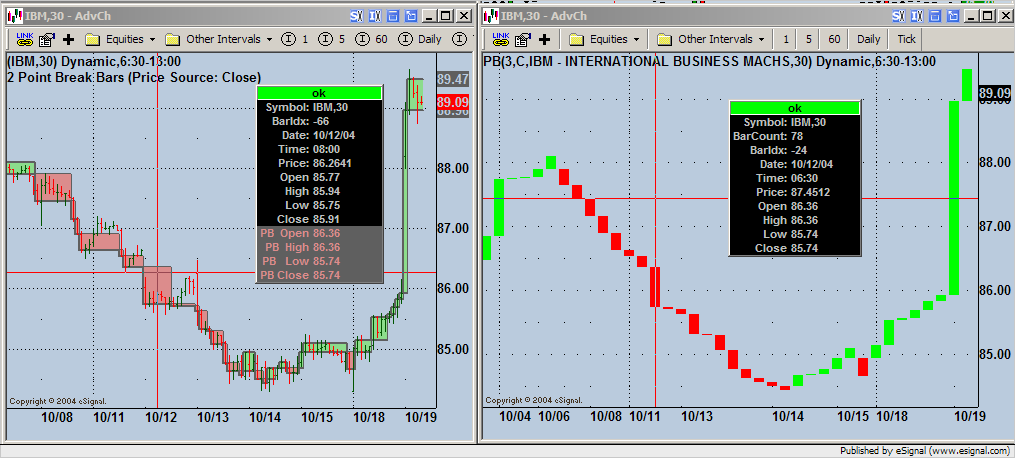
    At the moment we have as one of the chart choices the 3PB Chart. It requires however its' own chart window.Would it be possible to have the 3PB drawn on top of the normal candle or bar charts similar to the attached. I believe this would have considerable benefit.
    (I have only found unfinished references to this on the forums and apologise if the function already exists - if it does can somebody point me to it?)

    Cheers Kelvin
    Attached Files

  • #2
    Hello Kelvin,

    Thank you for making the suggestion. Please try the attached formula. This study replicates the Point Break logic on a bar chart. The colors and point break amount are configurable through the Edit Studies option.

    Attached Files
    Jason K.
    Project Manager
    eSignal - an Interactive Data company

    EFS KnowledgeBase
    JavaScript for EFS Video Series
    EFS Beginner Tutorial Series
    EFS Glossary
    Custom EFS Development Policy

    New User Orientation

    Comment


    • #3
      Hi Jason,

      great EFS.
      Yet if I don't have the chart on autoscale and move the chart around the EFS detaches from the candles.

      Furthermore if you could add an audio alert when a new box is drawn.

      Thanks,

      Matt

      Comment


      • #4
        Hello Matt,

        For alerts, you can add Alert.playSound("Ding.wav") to line 83 after if (bNew == true). The alert will sound when a new PB bar has been confirmed. If you want to have an alert sound on the first tick of a developing PB bar, add another Alert.playSound("filename.wav") call to line 184 after if (bNew == true).

        I haven't been able to reproduce the detachment of the study you described. Can you post an image of this? Perhaps give me a more detailed step-by-step description of how you are generating the error. Are you on version 7.7 currently?
        Jason K.
        Project Manager
        eSignal - an Interactive Data company

        EFS KnowledgeBase
        JavaScript for EFS Video Series
        EFS Beginner Tutorial Series
        EFS Glossary
        Custom EFS Development Policy

        New User Orientation

        Comment


        • #5
          Hi Jason,

          I will add the alert line, thanks.

          Once I reloaded the page with the EFS, it stopped separating, and I can't reproduce it either anymore !?

          If it does again I'll post an image.

          Thanks for all your help,

          Matt

          Comment


          • #6
            Hello Matt,

            I'd like to do some more testing on this problem. What symbol, interval and time template were you using when the problem occurred? Also, what is the version of eSignal you are currently using?
            Jason K.
            Project Manager
            eSignal - an Interactive Data company

            EFS KnowledgeBase
            JavaScript for EFS Video Series
            EFS Beginner Tutorial Series
            EFS Glossary
            Custom EFS Development Policy

            New User Orientation

            Comment


            • #7
              Jason,
              I am using the latest 7.7.
              Using a 3 day tick template trading a 900 tick ES chart.

              Matt

              Comment


              • #8
                Jason,

                could you please take a look at the formula.
                ever since I added compute on close and the alert line, the formula looks completely different compared to the original code.

                Thanks,

                Matt

                /************************************************** ***************
                Provided By : eSignal (c) Copyright 2004
                Description: Point Break Bars for Bar Chart

                Version: 1.0

                Notes:
                This study displays PB bars on regular bar or candlestick chart.

                Formula Parameters: Defaults:
                Point Break Amount 3
                Price Source Close
                Up Color Light Green
                Dn Color Light Red
                Outline Color Grey
                ************************************************** ***************/

                function preMain() {
                setPriceStudy(true);
                setStudyTitle("Point Break Bars");
                setCursorLabelName("PB Open", 0);
                setCursorLabelName("PB High", 1);
                setCursorLabelName("PB Low", 2);
                setCursorLabelName("PB Close", 3);
                setPlotType(PLOTTYPE_SQUAREWAVE, 0);
                setPlotType(PLOTTYPE_SQUAREWAVE, 1);
                setPlotType(PLOTTYPE_SQUAREWAVE, 2);
                setPlotType(PLOTTYPE_SQUAREWAVE, 3);
                setDefaultBarThickness(2, 0);
                setDefaultBarThickness(2, 1);
                setDefaultBarThickness(2, 2);
                setDefaultBarThickness(2, 3);
                setDefaultBarFgColor(Color.RGB(95,95,95), 0);
                setDefaultBarFgColor(Color.RGB(95,95,95), 1);
                setDefaultBarFgColor(Color.RGB(95,95,95), 2);
                setDefaultBarFgColor(Color.RGB(95,95,95), 3);
                setShowTitleParameters(false);
                setComputeOnClose(true);

                var fp1 = new FunctionParameter("nPB", FunctionParameter.NUMBER);
                fp1.setName("Point Break Amount");
                fp1.setLowerLimit(2);
                fp1.setDefault(3);
                var fp2 = new FunctionParameter("sSource", FunctionParameter.STRING);
                fp2.setName("Price Source");
                fp2.addOption("Open");
                fp2.addOption("High");
                fp2.addOption("Low");
                fp2.addOption("Close");
                fp2.addOption("HL/2");
                fp2.addOption("HLC/3");
                fp2.addOption("OHLC/4");
                fp2.setDefault("Close");
                var fp3 = new FunctionParameter("cUp", FunctionParameter.COLOR);
                fp3.setName("Up Color");
                fp3.setDefault(Color.RGB(140, 220, 140));
                var fp4 = new FunctionParameter("cDn", FunctionParameter.COLOR);
                fp4.setName("Down Color");
                fp4.setDefault(Color.RGB(220, 140, 140));
                var fp5 = new FunctionParameter("cOutline", FunctionParameter.COLOR);
                fp5.setName("Outline Color");
                fp5.setDefault(Color.RGB(95,95,95));
                }

                var aPBopen = null;
                var aPBhigh = null;
                var aPBlow = null;
                var aPBclose = null;
                var bInit = false;
                var vPBtrend = "Up"; // Up or Dn - Developing PB bar
                var vPBtrend1 = "Up"; // Up or Dn - Confirmed PB bar
                var bNew = false; // New PB bar
                var Price = null;
                var Price1 = null;


                function main(nPB, sSource, cUp, cDn, cOutline) {
                var nState = getBarState();

                if (nState == BARSTATE_NEWBAR) {
                Price1 = Price;
                vPBtrend1 = vPBtrend;
                if (bNew == true) Alert.playSound("Ding.wav");{
                // New PB bar confirmed, update PB arrays
                var vH = aPBhigh[0];
                var vL = aPBlow[0];
                if (vPBtrend == "Up") {
                aPBopen.pop();
                aPBopen.unshift(vH);
                aPBhigh.pop();
                aPBhigh.unshift(Price);
                aPBlow.pop();
                aPBlow.unshift(vH);
                aPBclose.pop();
                aPBclose.unshift(Price);
                } else if (vPBtrend == "Dn") {
                aPBopen.pop();
                aPBopen.unshift(vL);
                aPBhigh.pop();
                aPBhigh.unshift(vL);
                aPBlow.pop();
                aPBlow.unshift(Price);
                aPBclose.pop();
                aPBclose.unshift(Price);
                }
                }
                }

                Price = null;
                switch (sSource) {
                case "Open" :
                Price = open(0);
                break;
                case "High" :
                Price = high(0);
                break;
                case "Low" :
                Price = low(0);
                break;
                case "Close" :
                Price = close(0);
                break;
                case "HL/2" :
                Price = (high(0) + low(0) )/ 2;
                break;
                case "HLC/3" :
                Price = (high(0) + low(0) + close(0) )/ 3;
                break;
                case "OHLC/4" :
                Price = (open(0) + high(0) + low(0) + close(0) )/ 4;
                break;
                }

                if (bInit == false) {
                setStudyTitle(nPB + " Point Break Bars (Price Source: " + sSource + ")");
                setDefaultBarFgColor(cOutline, 0);
                setDefaultBarFgColor(cOutline, 1);
                setDefaultBarFgColor(cOutline, 2);
                setDefaultBarFgColor(cOutline, 3);
                aPBopen = new Array(nPB);
                aPBhigh = new Array(nPB);
                aPBlow = new Array(nPB);
                aPBclose = new Array(nPB);
                for (var i = 0; i < nPB; i++) {
                aPBopen[i] = Price;
                aPBhigh[i] = Price;
                aPBlow[i] = Price;
                aPBclose[i] = Price;
                }
                bInit = true;
                }

                // Test for new PB bar
                if (Price1 == null) return;
                bNew = false;
                vPBtrend = vPBtrend1;
                var nPBmax = aPBhigh[0];
                var nPBmin = aPBlow[0];
                for (var i = 0; i < nPB; i++) {
                nPBmax = Math.max(nPBmax, aPBhigh[i]);
                nPBmin = Math.min(nPBmin, aPBlow[i]);
                }
                if (vPBtrend == "Up") {
                if (Price > nPBmax) {
                bNew = true;
                } else if (Price < nPBmin) {
                bNew = true;
                vPBtrend = "Dn";
                }
                } else if (vPBtrend == "Dn") {
                if (Price > nPBmax) {
                bNew = true;
                vPBtrend = "Up";
                } else if (Price < nPBmin) {
                bNew = true;
                }
                }

                // Current or developing PB bar
                var nPBo = aPBopen[0];
                var nPBh = aPBhigh[0];
                var nPBl = aPBlow[0];
                var nPBc = aPBclose[0];
                if (bNew == true) { // New unconfirmed PB bar
                var vH = aPBhigh[0];
                var vL = aPBlow[0];
                if (vPBtrend == "Up") {
                nPBo = vH;
                nPBh = Price;
                nPBl = vH;
                nPBc = Price;
                } else if (vPBtrend == "Dn") {
                nPBo = vL;
                nPBh = vL;
                nPBl = Price;
                nPBc = Price;
                }
                }

                // PB Bar Coloring
                var PBColor = cDn;
                if (vPBtrend == "Up") PBColor = cUp;
                for (var i = 0; i < 4; i++) {
                setBarBgColor(PBColor, i, nPBl, nPBh);
                }

                return new Array(nPBo, nPBh, nPBl, nPBc);
                }

                Comment


                • #9
                  Hello Matt,

                  The difference is being caused by the Alert you added, which is in the wrong place.

                  You have:

                  if (bNew == true) Alert.playSound("Ding.wav");{
                  // New PB bar confirmed, update PB arrays


                  Change it to this:

                  if (bNew == true) {
                  Alert.playSound("Ding.wav");
                  // New PB bar confirmed, update PB arrays


                  This will fix the problem.
                  Jason K.
                  Project Manager
                  eSignal - an Interactive Data company

                  EFS KnowledgeBase
                  JavaScript for EFS Video Series
                  EFS Beginner Tutorial Series
                  EFS Glossary
                  Custom EFS Development Policy

                  New User Orientation

                  Comment


                  • #10
                    Great.

                    Thanks Jason.

                    Comment


                    • #11
                      Jason,

                      Any chance you can point me in the direction of how these point break bar charts work? What are the parameters for getting a green box and what for a red? I understand it has something to do with realtionship between closing price and previous bar high or low but what does the 3 point mean?

                      Thanks

                      David

                      Comment


                      • #12
                        Hi David,

                        Point Break Charts are often found under different names, Three Line Break, Three Point Break so on and so forth. The way they work is by basically measuring the strength of a rally or sell off compared to previous bars. Here are some things to remember when reviewing data from a Point Break chart.

                        If the price makes a new high compared to the high of the previous bar, then a new bar (green in this case) is constructed. If the price makes a new low compared to the low of the previous bar then a new bar is made (white in this case).

                        The caveat of Three Line Break charts is when three consecutive colors are made. If the chart builds three green bars, then the price must reverse below the low extreme of the series before a white bar is constructed. The same is true for the downside. If the chart builds three white bars, then the price must be able to surpass the high extreme of the series before a new green bar is built.

                        The (3) in Three Line Break refers to the reversal amount that a series must complete to be considered a true reversal.

                        Comment


                        • #13
                          Backtesting 3LB strategy

                          I am new to 3LB and formula programming. I appreciate the formula provided by Matt and Jason in this thread. I found it very useful. However, I would like to backtest this formula. Go long at the close of the first uptrend bar, and go short at the close of the first downtrend bar. Did someone already modify the formula to add the backtesting capability? If not, can someone give me a tip on how to do that? Thanks so much.

                          Comment


                          • #14
                            chihsia
                            If you run the FWguide3BarBrkOut.efs on a 3PB chart it should do what you are looking for.
                            The efs was written using only the Formula Wizard and you can see how it was done by following the relative link in the Formula Wizard Guide.
                            Alex

                            Comment

                            Working...
                            X