 Tweet
Tweet
Is there an efs study that will draw a continuous horizontal line at a specified time? If this isn't already done how could it be created?
-
-
smart1
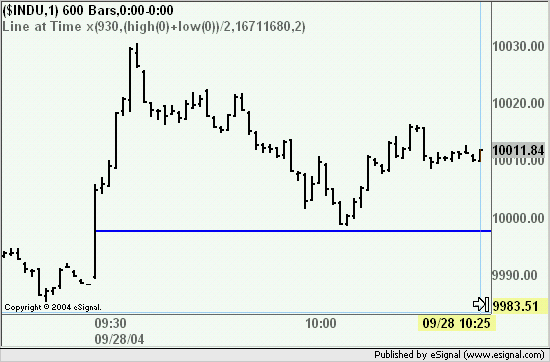
The enclosed efs will draw a line from a price and time defined in Edit Studies (defaults are Open and 930).
Starting time, price, color and thickness of the line can be modified in Edit Studies. Price also includes an empty option to allow for a user defined value which can be a number or an expression such as for example (high(0)+low(0))/2 (see image below as an example)
Alex
PHP Code:function preMain(){
setPriceStudy(true);
setStudyTitle("Line at Time x");
setShowCursorLabel(false);
var fp1 = new FunctionParameter("vTime", FunctionParameter.NUMBER);
fp1.setName("Time (hhmm)");
fp1.setDefault(930);
var fp2 = new FunctionParameter("vSource", FunctionParameter.STRING);
fp2.setName("Price");
fp2.addOption("close(0)");
fp2.addOption("high(0)");
fp2.addOption("low(0)");
fp2.addOption("open(0)");
fp2.addOption(" ");
fp2.setDefault("open(0)");
var fp3 = new FunctionParameter("vColor", FunctionParameter.COLOR);
fp3.setName("Line Color");
fp3.setDefault(Color.blue);
var fp4 = new FunctionParameter("vThick", FunctionParameter.NUMBER);
fp4.setName("Line Thickness");
fp4.setLowerLimit(1)
fp4.setDefault(2);
}
var vPrice = 0;
var vBarCntr = 0;
function main(vTime,vSource,vColor,vThick){
if(getBarState()==BARSTATE_NEWBAR){
vBarCntr ++;
}
if((getHour()*100)+getMinute()==vTime){
vBarCntr = 0;
vPrice = eval(vSource);
}
if(getBarState()==BARSTATE_NEWBAR){
clearLineTool(LineTool.RAY);
addLineTool(LineTool.RAY,-vBarCntr,vPrice,-vBarCntr+1,vPrice,vThick,vColor,"Line1");
}
return;
}
-
Alexis, thank you very much for sending me this formula. It works great but only in 1/2 hour increments. Is there a way to program it for minutes, i.e. 6:46am? Also, is it possible to display this price on the cursor window and/or the chart? Will this reload after closing the program at night and restarting in the morning before mkt opens? Or, if I leave the program on for 24 hours what time of day does it recalculate? Again, I really appreciate your time.
Thanks, SteveComment
-
Steve
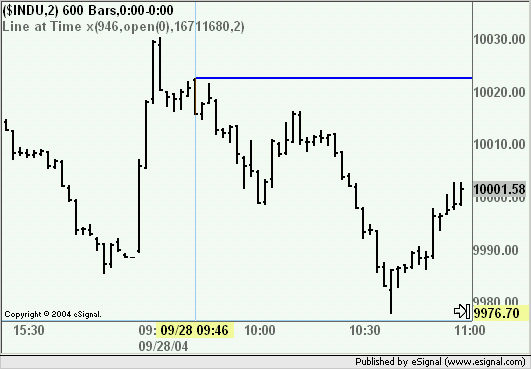
It works great but only in 1/2 hour increments
It can work with any time increment down to 1 minute. However because the efs uses the price data's time if a bar with that specific time stamp is not displayed on a chart then the line will not be drawn. In the chart below I am plotting 2 minute bars so as to display a bar with a 9:46 time stamp (which I suppose is the equivalent of the 6:46 you are referring to) and as you can see the line draws from that bar.
Also, is it possible to display this price on the cursor window and/or the chart?
In its current state the efs is not returning any data points to the chart so it would have to be modified to show the value in the Cursor Window. Alternatively the value could be written as text on the chart itself.
Will this reload after closing the program at night and restarting in the morning before mkt opens?
It should
Or, if I leave the program on for 24 hours what time of day does it recalculate?
It will recalculate the line at the next occurrence of a bar with the user defined time stamp.
AlexComment
-
Alexis, this works great!!! I understand if there's no price action during the defined minute a line won't be drawn. I won't need a display because I get an estimated price in the right margin.
Changing hi/lo alerts more quickly is extremely important to me. I've used the Edit Status Window with a fomula and also the Alert Status Window....both are too slow. Is there any way I can place "control panels" on a chart? That's the one that shows "Your Value Here" and will be used with an efs formula. I like price alert filewrite.efs because the alert sounds with up/dwn crossings of the defined prices without needing a reset.
Thanks again for all your help....you're the man!!Comment
-
Steve
Changing hi/lo alerts more quickly is extremely important to me. I've used the Edit Status Window with a fomula and also the Alert Status Window....both are too slow
FWIW in 7.7 you can now set Alerts directly from within an Advanced Chart. To do this place the cursor at the price level at which you want to set an Alert then right click the chart and select Set Alert xxx.xx. this will open the Add Alert window which will already have the selected price in the Last High or Last Low box depending if the Alert is above or below the current trading price. You may find this a faster entry method then going through the Alert Status Window.
AlexComment
-
Alexis, thanks for alerting me to this new feature which allows me to place multiple hi/lo alerts on any stock during early morning trading. There's no visual price display on the chart or the Window Cursor so my workaround is keeping the Alert Status Window open but then the "set alert xx.xx" is greyed out. I've also used the Quote Window to ID a hi/lo trigger with green/red hilites but there is a false-color gliche using this method. Any ideas on that? You've really been a tremendous help!
SteveComment
-
Steve
there is a false-color gliche using this method. Any ideas on that?
I am not sure I understand what kind of glitch you are seeing. Perhaps you may want to post a screenshot.
Also you may want to try changing the colors in the Quote Window for the Realtime Line Text/Background or for the High and Low Alert Text/Background.
AlexComment
-
Quote Window
Hi Alex, the "gliche" is in the new vs 7.7 and is known by tech support. In the quote window, if it's the first time an alert has triggered for that symbol it will hilite with appropriate color. However, that cell will not change color if the opposite alert is triggered, i.e. from green(hi) to red(lo). All other color settings were checked out to make sure they weren't "masking" the hilite alert colors.Comment
Comment