Announcement

Collapse
No announcement yet.

Help with Keltner Bands

Collapse
X
 
  • Filter
  • Time
  • Show
Clear All
new posts

  • Help with Keltner Bands

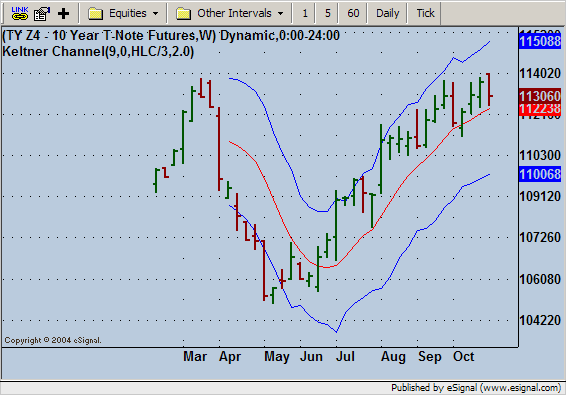
    I need help with matching up the standard Keltner Bands (Keltner.efs) in eSignal to those produced in the Ensign charting software. Within Ensign, you have the ability to introduce a multiplier - something not available in the standard eSignal study. The exact parameters that I'm seeking to match are:

    Multiplier of 2
    Ave (period) of 9

    Thanks!!!
    ChiSales

  • #2
    ChiSales
    You should be able to find what you are looking for here
    Alex

    Comment


    • #3
      Hi jthursby,

      You may also want to read through this article from the EFS Knowledge Base. It contains the raw code and the developer comments regarding the study that Alexis referenced.

      Comment


      • #4
        I've looked at the Ensign Keltner Band that I am trying to replicate, and I think that it is based off of a Simple Moving Average. . . versus the Extended Moving Average that is used in all of the posted modified Keltner Bands. I think with that change, it might make the difference. Does
        anyone supply a version that has that?

        Thanks!
        ChiSales

        Comment


        • #5
          ChiSales
          You can find a version of the Keltner channel that uses simple moving averages here. This one replicates the version available in TradeStation.
          Available here instead is a variant of one of the Keltner studies from the link in my prior message. This one replaces the exponential moving average with a simple moving average and adds alerts (which can be easily removed)
          FYI I found both of these by running a Search for Keltner.
          Alex

          Comment


          • #6
            Hello Jonathan,

            Did either of the studies Alex pointed you to match your ensign study?
            Jason K.
            Project Manager
            eSignal - an Interactive Data company

            EFS KnowledgeBase
            JavaScript for EFS Video Series
            EFS Beginner Tutorial Series
            EFS Glossary
            Custom EFS Development Policy

            New User Orientation

            Comment


            • #7
              Hi Alex,

              let me butt in for a second in regards to searches.
              I am not too good at finding anything with esignal so maybe I go the wrong way about it.
              If I want to find a formula, I normally try the file sharing search which typically finds about zero.
              So I guess searching esignal central is the way to go.
              Why don't I ever find anything under file sharing ?
              Thanks as usual for all your assistance.

              Matt

              Originally posted by Alexis C. Montenegro
              ChiSales
              You can find a version of the Keltner channel that uses simple moving averages here. This one replicates the version available in TradeStation.
              Available here instead is a variant of one of the Keltner studies included in the link in my prior message. This one replaces the exponential moving average with a simple moving average and adds alerts (which can be easily removed)
              FYI I found both of these by running a Search for Keltner.
              Alex

              Comment


              • #8
                the most recent version that was recommended is very -very close, but still off by a few ticks on the upper and lower bands. The center moving average line is spot on. I haven't yet, but my next step is to try a different multiplier than 2. . . perhaps 2.1, or something similar, etc. . .

                to give you a point of reference, sample data points that I'm trying to match would be in Ensign:

                On a weekly December Ten Year Notes (TY Z4) chart, the three bands for some random dates are:

                10/22/04
                114-318 Upper
                112-170 Middle (simple MA)
                110-022 Lower

                9/17/04
                113-269 Upper
                111-170 Middle (simple MA)
                108-022 Lower

                8/4/04
                111-132 Upper
                108-207 Middle (simple MA)
                105-283 Lower

                thanks,
                Jonathan
                ChiSales

                Comment


                • #9
                  Hello Jonathan,

                  Ok, so all we need to find out now is what formula the bands are based on. I can think of three options. There's probably more, but it's likely to be one of these three.

                  1. Average True Range over a specified period * multiplier
                  2. Average Range over a specified period * multiplier
                  3. Fixed percentage from basis line

                  If you could post an image of the ensign chart, we should be able to figure it out.
                  Jason K.
                  Project Manager
                  eSignal - an Interactive Data company

                  EFS KnowledgeBase
                  JavaScript for EFS Video Series
                  EFS Beginner Tutorial Series
                  EFS Glossary
                  Custom EFS Development Policy

                  New User Orientation

                  Comment


                  • #10
                    Hello Jonathan,

                    Thanks for sending me the ensign images. Looks like the attached formula, which is Alex's version he made for the trade station reproduction, does the trick. The key was the price source. I noticed in the parameters window you sent me, the price source was set to HLC/3. I saved the defaults for you 9, 2 with HLC/3 as the default price source in the attached. You should have an exact match now. By the way, ensign bases their bands on the same formula as TS, which is the difference of MA of High - MA of Low.

                    ensign


                    Attached Files
                    Jason K.
                    Project Manager
                    eSignal - an Interactive Data company

                    EFS KnowledgeBase
                    JavaScript for EFS Video Series
                    EFS Beginner Tutorial Series
                    EFS Glossary
                    Custom EFS Development Policy

                    New User Orientation

                    Comment


                    • #11
                      Jason and Alex. . . thank you!

                      It looks like you've found the winning combination. Outstanding!

                      Jonathan
                      ChiSales

                      Comment


                      • #12
                        All. . . everything is now moving forward very well with the latest iteration of the Keltner Bands. The only aspects that are on the wish list are some cosmetic tweaks. 2 things were trying to do:

                        1. Give the chart a black background - when the colors are changed, the O, H, L, L values can not be seen. The background behind the values are the same color as the text and it is not possible to have them set differently.

                        2. Change the colors of the Upper and Lower Bands. In changing the properties, there is only one color field available. . . which turns all 3 bands into same color. Ideally, each can be altered uniquely. . . or at least the the middle MA line one color and the Upper/Lower bands another.

                        Any help out there in modifying the last posted version of the Keltner Bands would be greatly appreciated.

                        thanks,
                        Jonathan
                        ChiSales

                        Comment


                        • #13
                          Jonathan
                          The attached revision of the efs adds the option to color the Keltner basis and band lines through Edit Studies
                          Alex

                          Attached Files

                          Comment


                          • #14
                            Jonathan
                            With regards to the color of the OHLC values right click the Cursor Window, click the Font button and select a different color
                            Alex

                            Comment


                            • #15
                              Got it!!! Everything is set cosmetically now. Changing the colors in the dataview box is a little querky. . . but I found a combination that works. I can't thank you enough for all your help and prompt turn around on postings!!

                              Jonathan
                              ChiSales

                              Comment

                              Working...
                              X