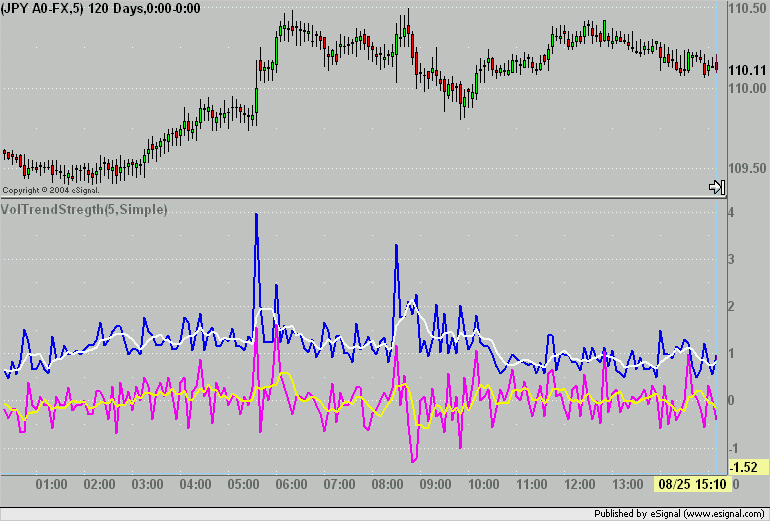
Hi, I was wondering if anybody would be so kind to modify this indicator for esignal, the name is VolitilityTrendStrength and it was created originally for the VT system and is the best volatility indicator that exist, in my opinion.
Here is the formula and the notes from the author...
I will also insert the indicator anyone who has vt (free to download) can use it on that and see how it looks like.
VolitilityTrendStrength
formula
HL200 := mov(ref(H,-1) - ref(L,-1), 200, S);
HLcur := (H-L)/HL200;
HLma := mov(HLcur, Per, MAtype);
OCcur := (C-O)/HL200;
OCma := mov(OCcur, Per, MAtype);
here few notes from the author:
Two indicators developed by David W. Thomas to plot together to indicate both volatility and strength of the trend or indicate a sideways market.
The light (shadow-like) plots are the actual bar values, the colored plots are those values calculated through a moving average.
The volatility and trend are normalized by a 200 period moving average of the High - Low. The volatility is the High - Low and the trend indicated by Close - Open.
Both indicators near zero in a sideways market. A fast trend will put both indicators further from zero.
This is most useful in the short time frames (less than 60min).

Comment