Announcement

Collapse
No announcement yet.

Single EFS looking at two Bar Lengths

Collapse
X
 
  • Filter
  • Time
  • Show
Clear All
new posts

  • Single EFS looking at two Bar Lengths

    Hi,

    Can anybody tell me if it is possible within one EFS to be able to take a signal from two different bar lengths. For example, say I am looking at an hourly chart, and want to take either all the long signals I get from a MA crossover signal, or all the short signals I get from that same MA crossover signal, but the decision to take the longs or the shorts on the hourly bars is a function of the trend of the DAILY bar chart. (e.g. MA on the Daily chart).

    I thus want to be able to be running the EFS on the hourly bars, but taking a signal (a permission long or a permission short signal it could be called) from the daily bars to get the trend one degree higher.

    Any code examples would be greatly appreciated.

    As ever, I'm truly grateful for your assistance folks.

    Have a great weekend.

    Neil.

  • #2
    Neil:

    The short answer is that multi-timeframe work will become much easier and more intuitive when EFS2 is released. Using EFS in its current form, it can be done (multi-timeframe work, that is) but it requires a little effort since you are responsible for synchronizing the data on the various bar intervals.

    See the attached script for an example. Load it into an Intraday chart (e.g., a 5-min chart) and it will plot a 25-bar simple MA in that bar interval and will also calculate and plot a 25-bar simple MA from the Daily bar interval.

    Chris
    Attached Files

    Comment


    • #3
      hi Chris,

      I was reading your sample code posted here and noticed something I don't understanding about scripting language in EFS (being a novice to EFS)...

      you declared a global variable called nSymbol (which is not being used), and then in main() you assigned an undeclared variable sSymbol an value of getSymbol()+",D"

      The script works...how come EFS did not complain that sSymbol is not defined? (and did you mean to use nSymbol?)

      Thanks. z11

      Comment


      • #4
        Yes, you caught me there I was typing too fast. nSymbol was a typo and should have been declared as sSymbol.
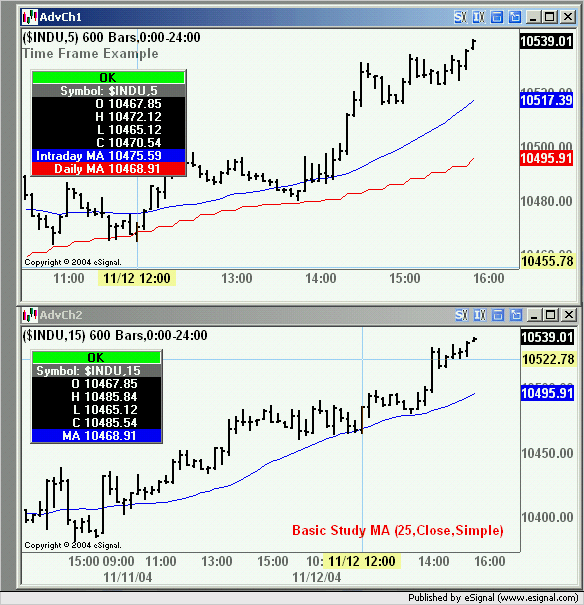
        Javascript allows you to declare variables on the fly so even though sSymbol was not officially declared, it was created it for me anyway. If, however, I had tried to assign the value of sSymbol to some other variable, EFS would have generated an error because at that point there was no such variable called sSymbol and, therefore, no value to assign.

        The issue of scope is less clear (to me at least). Since sSymbol was not officially declared outside of main(), the sSymbol it created for me in my initialization section should (one would think) have been a variable that was local to main()..... however it would appear that sSymbol actually has scope at the script level.

        Chris

        Comment


        • #5
          Chris, Thanks for the detailed explanation.

          I have been trying to overlay 1 time frame's stochastics over another but visually I can't seem to come to a notion that it would make sense.... have you seen anything like that done?

          Comment


          • #6
            That kind of thing will be much easier when EFS2 rolls out. To do that now you would have to write your own stochastic function that uses bars from a different time interval and you would have to use bar date/time stamps to synchronize the data between the two streams.

            Chris

            Comment


            • #7
              Single EFS looking at two Bar Lengths

              Hi Chris,

              Wow - that code really takes it up a level ! Thanks - it does exactly what I want it to do in terms of functionality. Please forgive the fact that my newbie status means I wouldn't know (without spending many hours - and then no guarantees !) how to change that code to have the shorter time frame (your intraday) to be a daily bar; and the higher order time bar to be a variable multiple of that daily bar (easily modifiable in backtesting to be either 5, 10 or say 20 days - or any number of days.

              Is it possible to easily modify the code to make it work as I have outlined above ?

              Thanks once again for opening my eyes to the possibilities with EFS. Do you have any notion of when EFS2 will become available ?

              Thanks for your help.

              Neil.

              Comment


              • #8
                Neil:

                I don't believe so, because the bar interval that you are referencing in the script must be a valid bar interval that is definable within eSignal. There is no method (that I am aware of at least) to create the equivalent of a 3-day, 10-day or 20-day bar. So, you could be viewing Daily bars and have an MA created off of Weekly or Monthly bars... but I don't believe that you could view Daily and create an MA based off of, say, 6-day bars. If I'm wrong about this, I'm sure someone will chime in.

                Chris

                Comment


                • #9
                  Hi Chris, I was playing with your sample code posted here and changed sSymbol to "xyz,15" ,30, etc (the second period)....and MAs produced by the code don't match with values given by MAStudy(...) if you pull a 15 or 30 etc minute chart separately...

                  I don't seem to see any problem with the way you calculate offsets... would you take a second look at the code? Thanks.

                  Comment


                  • #10
                    z11
                    They appear to be matching at my end with the second period set to 15. See both the last value at the Y-axis label and that in the Cursor Window which is at a random point in the past
                    Alex

                    Comment


                    • #11
                      Thanks Alex....my apologies Chris ... I had exponential ma on in the separate chart...sorry.

                      Comment


                      • #12
                        Hi Chris and Alexis,

                        Thanks for the replies thus far. Chris, you wrote a couple of posts ago

                        "So, you could be viewing Daily bars and have an MA created off of Weekly or Monthly bars......."

                        I would like to have a go with the Daily bars viewing a weekly MA. Please would you be so kind as to modify your code to do that ? I would like to see what it looks like.

                        Thanks again in advance.

                        Neil.

                        Comment


                        • #13
                          Example attached.

                          Chris
                          Attached Files

                          Comment


                          • #14
                            Chris,

                            That is great - many thanks!

                            Neil.

                            Comment


                            • #15
                              Hi,

                              Using the modified code Chris last posted (modified to have a daily and weekly MA), does anybody know how I could code a buy signal into the code to buy if the Weekly MA is higher this week, than it was last week; and sell if the Weekly MA is lower this week than it was last week?

                              Also, is there any way the Weekly MA in the Chris' code be amended to be exponential rather than simple ?

                              Many thanks

                              Neil.

                              Comment

                              Working...
                              X