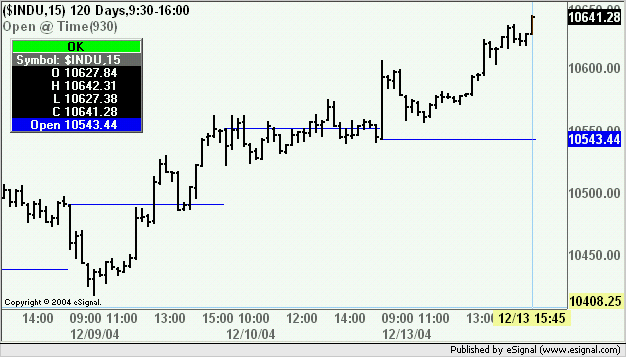
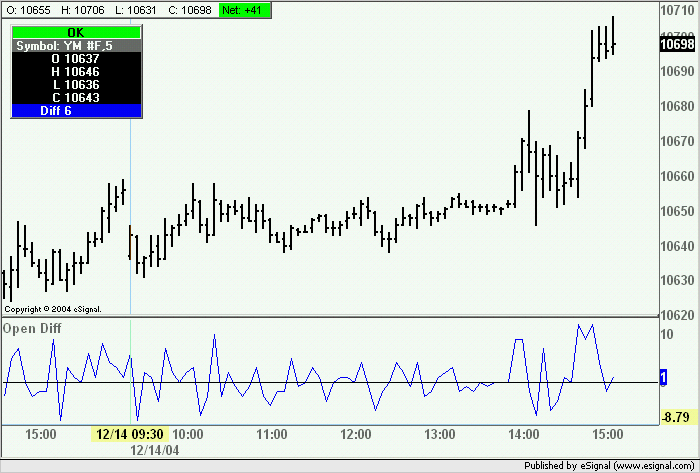
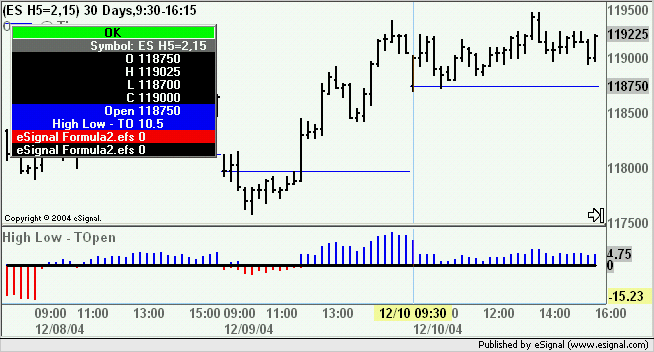
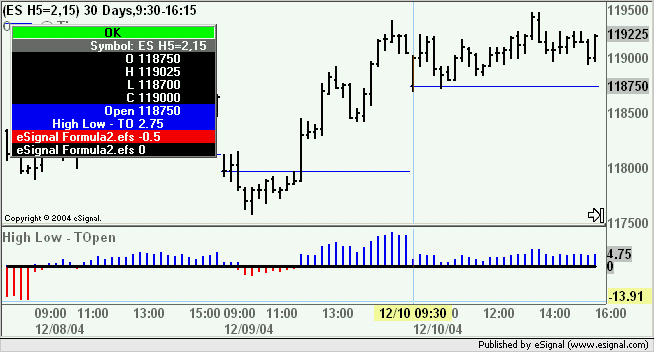
I am searching for the efs.formula to plot a Flatline in the chart at the open-value of a bar that may be specified by my own.
For example I would like to plot the open-value from the 9:30 bar in my S&P-Globex Charts.
Thanks for guiding me.
For example I would like to plot the open-value from the 9:30 bar in my S&P-Globex Charts.
Thanks for guiding me.


Comment