Announcement

Collapse
No announcement yet.

New Study - Hull Moving Average

Collapse
X
 
  • Filter
  • Time
  • Show
Clear All
new posts

  • New Study - Hull Moving Average

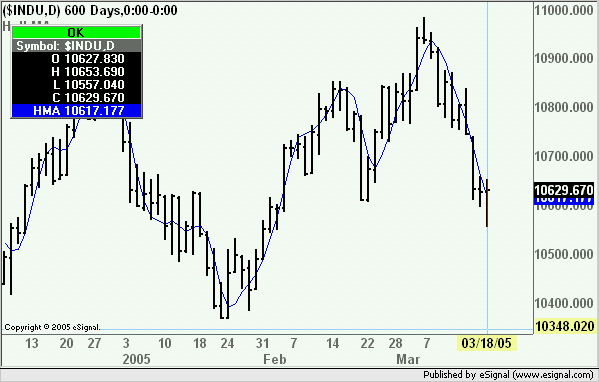
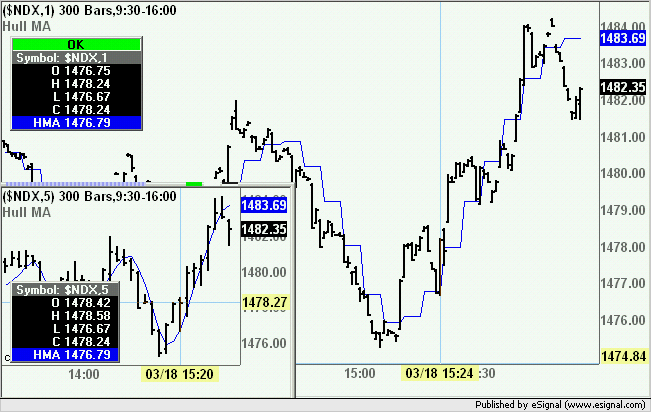
    I would love to see this new study added. It's the hull moving average which is simply a low lag moving average plotted on the price axis just as with a regular moving average. I attempted to use the wizard but got a bit lost trying to insert calcs within the weighted moving average.

    Here is the TradeStation code:

    Input: price(medianprice),period(10);
    vars:Len1(IntPortion(0.5*Period)),Len2(IntPortion( Squareroot(Period))),HullMa(0);
    HullMa=WAverage(2*WAverage(Price,Len1)-WAverage(Price,Period),Len2);
    Plot1(HullMa,"HullMa");

    Thanks in advance for any assistance.

  • #2
    Rick
    The attached efs computes the Hull MA.
    Length, offset and source can be modified through Edit Studies
    Alex

    Attached Files

    Comment


    • #3
      Wow- That was incredibly fast! Thank you very much.

      Best,
      Rick

      Comment


      • #4
        Rick
        You are most welcome
        Alex

        Comment


        • #5
          Hull MA for EFS2

          Attached is a version of the Hull MA rewritten using EFS2 syntax and which is now enabled for use with multiple symbols/intervals. Copy of the efs is also available here. This study requires version 7.9 beta 1 or later.
          In the image enclosed below you can see the Hull MA being plotted on a 1 minute chart but calculated on a 5 minute interval. A 5 minute chart is also shown for comparison.
          This efs provides an example of how to use the new efsInternal() function to create a custom variable/series that can then be passed as a source to a builtin study.
          NOTE: For information on the new efs() and efsInternal() functions see this thread.
          Alex

          Attached Files

          Comment


          • #6
            Hi,

            trying to modify hullma2 to give a coloured line depending on gradient of line, have tried a few things but nothing seems to work for me.

            Have included code, would be greatful for any help.

            Paul.
            Attached Files

            Comment


            • #7
              Paul
              FYI the efs you posted does not contain any changes respect to the original so it is not clear what you are trying to accomplish. Post your modified code and someone may be available to assist you in resolving the problems you are encountering
              Anyhow you can use the getValue() method to retrieve prior values of the HMA ie HMA.getValue(0) is the value at the current bar, HMA.getValue(-1) is the value at the prior bar, etc. This is no different than what you would do if you were using a built-in study.
              Alex

              Comment


              • #8
                Hi Alex,

                you are right I accidentally posted an unmodified version - will try your suggestion.

                Thanks

                Paul.

                Comment


                • #9
                  Is there anyway to plot the derivative of the Hull Moving Average?

                  The formula would be easy:

                  Current HMA - Previous HMA
                  -----------------------------------------------
                  Previous HMA

                  I just don't know how to program that into Esignal.

                  The derivative line can be plotted on either the chart or on a subchart.

                  Thanks for your help.

                  Comment

                  Working...
                  X