Announcement

Collapse
No announcement yet.

Previous Day High Low?

Collapse
X
 
  • Filter
  • Time
  • Show
Clear All
new posts

  • Previous Day High Low?

    Hello,
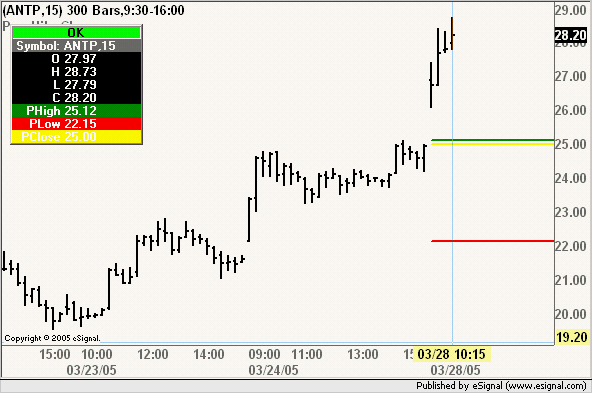
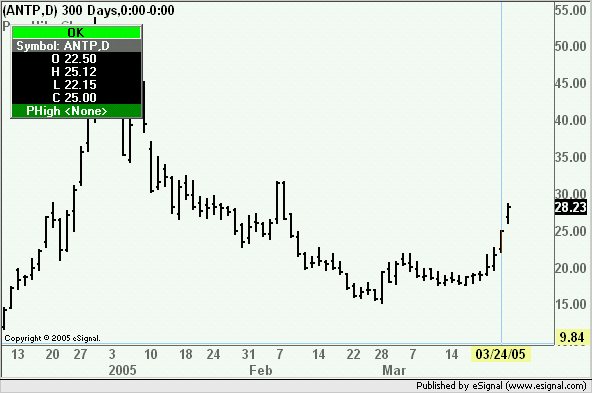
    Is there an efs that will display the previous day high and low, via horizontal lines, so I can see when/if the current day pps crosses above yesterday's high..or below yesterday's low?
    Thanks in advance, still looking but not finding one here yet

  • #2
    TradeJen
    You already have those efs(s) in the OHLC subfolder of Formulas
    Alex

    Comment


    • #3
      Thanks Alex, ok, I'm looking at those formulas, and I don't see any just like what I am looking for; in that I would only like the previous day open and close (no lines for all the past days to show up on a minute chart, just the previous day), and would like the lines to be a ray to the right, instead of ending at the end of that day . (for ex. I am looking at Previous Day Daily Bars; and also looking at. I'd like it to show up as a continous horizontal line for the high and low of the previous day, to show those levels of support and resistance. without having to visually look back at the prior day and estimate where that line would cross at, say, 2:00pm the next day.
      Hope that makes sense, or that you can point me to a variation that I'm not seeing in my OHLC folder.
      Thanks again,

      Comment


      • #4
        TraderJen
        The enclosed script will plot a ray (only on the current day) at the previous High and Low values.
        Alex

        PHP Code:
        function preMain() {
            
        setPriceStudy(true);
            
        setStudyTitle("PrevHiLo");
            
        setCursorLabelName("PHigh",0);
            
        setCursorLabelName("PLow",1);
            
        setDefaultBarFgColor(Color.blue,0);
            
        setDefaultBarFgColor(Color.red,1);
        }

        var 
        vHigh null;
        var 
        vLow null;
        var 
        vCntr 0;
        var 
        vStart 0;

        function 
        main(Time) {

            
        clearLineTool(LineTool.RAY);
            
            if(
        getBarState()==BARSTATE_NEWBAR){
                
        vCntr++;
            }
            
            if(
        getDay(0)!=getDay(-1)){
                
        vCntr 0;
            }

            
        vHigh call("/OHLC/getPrevOHLC.efs""High");
            
        vLow  call("/OHLC/getPrevOHLC.efs""Low");
            
            if(
        vHigh==null||vLow==null
            return;

            
        addLineTool(LineTool.RAY, -vCntrvHigh0vHigh2Color.blue"High");
            
        addLineTool(LineTool.RAY, -vCntrvLow0vLow2Color.red"Low");

            return new Array (
        formatPriceNumber(vHigh),formatPriceNumber(vLow));

        Comment


        • #5
          Thank you

          Thank you! That works great, appreciate it.

          Comment


          • #6
            Previous Day High-Low-Close

            I've noticed an error when using this formula on one stock ANTP: rather than using the Previous Day High and Close data as it should; the intraday charts (ie 5 min, 60 min) are using Today's High etc:

            I noticed this problem on Thursday; and it is happening again today.

            Here is the correct previous day high and
            High: 22.82
            Close:21.66

            Here is what it is using:
            Prev High: 28.40
            Close: 27.99 (as of 10:16am EST)

            Here is the efs:
            function preMain() {
            setPriceStudy(true);
            setStudyTitle("PrevHiLoClose");
            setCursorLabelName("PHigh",0);
            setCursorLabelName("PLow",1);
            setCursorLabelName("PClose",2);
            setDefaultBarFgColor(Color.green,0);
            setDefaultBarFgColor(Color.red,1);
            setDefaultBarFgColor(Color.yellow,2);
            }

            var vHigh = null;
            var vLow = null;
            var vClose = null
            var vCntr = 0;
            var vStart = 0;

            function main(Time) {

            clearLineTool(LineTool.RAY);

            if(getBarState()==BARSTATE_NEWBAR){
            vCntr++;
            }

            if(getDay(0)!=getDay(-1)){
            vCntr = 0;
            }

            vHigh = call("/OHLC/getPrevOHLC.efs", "High");
            vLow = call("/OHLC/getPrevOHLC.efs", "Low");
            vClose = call("/OHLC/getPrevOHLC.efs", "Close");

            if(vHigh==null||vLow==null||vClose==null)
            return;

            addLineTool(LineTool.RAY, -vCntr, vHigh, 0, vHigh, 2, Color.green, "High");
            addLineTool(LineTool.RAY, -vCntr, vLow, 0, vLow, 2, Color.red, "Low");
            addLineTool(LineTool.RAY, -vCntr, vClose, 0, vClose, 2, Color.yellow, "Low");

            return new Array (formatPriceNumber(vHigh),formatPriceNumber(vLow), formatPriceNumber(vClose));
            }

            Thanks in advance,

            Comment


            • #7
              P.S. Prior Day Low

              Actually the Prior Day Low is wrong also; it is actually 19.67
              but efs is reporting it as 22.15

              Comment


              • #8
                TraderJen
                As far as I can see the efs you posted is returning the correct values (see attached image)
                Alex

                Comment


                • #9
                  My chart

                  Hi, My chart looks nothing like yours; How do I post my chart so you can see it?

                  Comment


                  • #10
                    TraderJen
                    Here is the Daily chart with the Cursor on the bar of 3/24
                    The values you are referring to are those for 3/23
                    Alex

                    Comment


                    • #11
                      TraderJen
                      Try refreshing the chart (ie click the OK in the Cursor Window while pressing the Ctrl key)
                      Alex

                      Comment


                      • #12
                        Re: Refresh

                        Hi Alex,
                        I tried that; but it is still using out of date data for the Prev Hi-Low-Close
                        Would it be helpful for me to post my chart so you can see it too?

                        Comment


                        • #13
                          re Daily Chart

                          Alex, right now my daily chart is wrong too I see; it is showing today's trading on 3/24. (versus for today's date.) That's why I got those 3/23 previous day data off the daily chart; I didn't notice the daily chart problem til just now.
                          For ex. right now on daily chart it shows Low22.15
                          High 28.729
                          Close 27.87
                          Volume 1.960,585
                          So somehow the data for 3/24 and today lumped in together

                          Comment


                          • #14
                            TraderJen
                            As I said run a refresh on the daily chart or close and restart eSignal and the Data Manager
                            Alex

                            Comment


                            • #15
                              Refresh

                              Hi Alex, when I changed the chart view to daily and used the refresh as you suggested this time it did update the daily data, and now also the efs is right.
                              Guess which chart view is up (ie min or daily) affects the refresh.
                              Thanks!

                              Comment

                              Working...
                              X