Announcement

Collapse
No announcement yet.

4 MACD indicator overlay problem

Collapse
X
 
  • Filter
  • Time
  • Show
Clear All
new posts

  • 4 MACD indicator overlay problem

    Hello Jason, Alex or others,
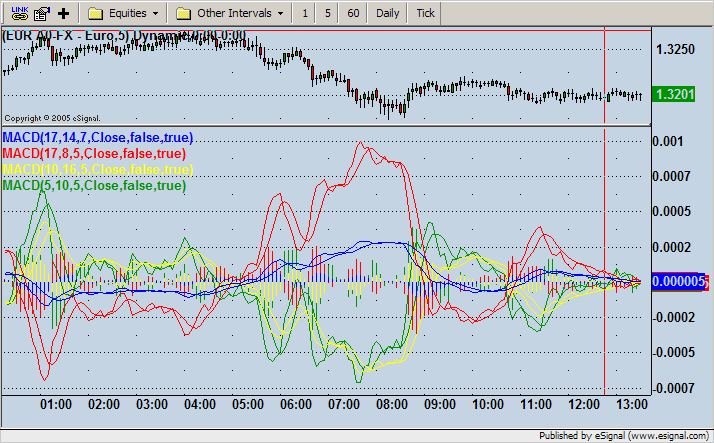
    I've been reading about the 4 MACD indicator developed by Robert Cummings and have tried to set this up in eSig. Its created by overlaying 4 MACD's with different settings and colors. I've overlayed indicators before using the 'scale right' setting which has lined up the zero line AOK. But when trying this with the 'Builtin MACD.efs.' it doesn't want to line up. Suggestions?

    In the screenshot of this in Wordens 2000 they've adjusted the histogram thickness and only shown the signal line for each of the overlayed 4 MACD's. Is this possible in eSignal? I've scoured the forum for alternate MACD efs formulas in case they would provide the control over wide histogram, signal line only & overlay line-up issues. No luck so far. I've listed the MACD settings below and included screenshots of my attempt and the way it should look below.

    Could someone assist? Thanks very much.
    --------------------------------------------
    MACD, (Blue) Exp, 17/14/7, Histogram Wide

    MACD, (Red), Exp, 17/8/5, Histogram Wide

    MACD (Yellow) Exp10/16//5 Histogram Wide

    MACD, (Green), Exp, 510/5, Histogram
    (= green over yellow, red over blue)


    Lon K. (Jouster)
    Attached Files

  • #2
    4 MACD indicator- my attempt

    Here's my attempt with overlaying four of the 'builtin MACD.efs'. I set 'display right', 'scale right' in edit studies.

    LK
    Attached Files

    Comment


    • #3
      Lon
      The easiest way to do this is to write the efs using the Formula Wizard and set up the plots as Histograms returning only HIST for each study.
      In the return statement set them in the following order 17/14/7, 17/8/5, 5/10/5 and last 10/16/5.
      That should give you the result you are looking for
      Alex

      Comment


      • #4
        Hello LK,

        After you merge the four studies, you then need to go into Edit Studies and set each study to display right and scale right. You currently only have one study with those settings. The action of merging studies changes the display setting to display right and no scale by default.

        Jason K.
        Project Manager
        eSignal - an Interactive Data company

        EFS KnowledgeBase
        JavaScript for EFS Video Series
        EFS Beginner Tutorial Series
        EFS Glossary
        Custom EFS Development Policy

        New User Orientation

        Comment


        • #5
          4MACD with Wizard

          Alex and Jason,
          Thanks for your responses. Yes, Jason you're right the individual edit studies for the last three overlayed MACD's defaulted to 'no scale' and threw it off. I switched them all to 'scale right' and its better.

          As I read the article describing the indicator closer, I realized that I only need the histograms of the 4 MACDs--no signal ma's. The lines in the screen shot are an 'On Balance Volume' line + 'Wilder's RSI'. I'm not sure if I should include those in this wizard composite process but thought I should solve the MACD combo first. I followed your suggestion Alex, and gave the formula wizard a try. From your comment it seemed you were suggesting I combine all 4 in one formula correct? I'm not experienced with the wizard but tried to include all four MACDs with Histogram selected. I wasn't quite sure what to do with the 'if/then' arguments, as I only want it to print a histogram in the indicator panel window. When I run syntax check I get an error on line #61, which is;

          vMACD17_14.getValue(MACDStudy.HIST) < &&

          I've pasted in what I created below. Any suggestions on how to solve the error?
          Thanks,
          Lon K.


          ------------------------------------
          //{{EFSWizard_Description
          //
          // This formula was generated by the Alert Wizard
          //
          //}}EFSWizard_Description 7532


          //{{EFSWizard_Declarations

          var vMACD17_14 = new MACDStudy(17, 14, 7, "Close", false);
          var vMACD17_8 = new MACDStudy(17, 8, 5, "Close", false);
          var vMACD5_10 = new MACDStudy(5, 10, 5, "Close", false);
          var vMACD10_16 = new MACDStudy(10, 16, 5, "Close", false);
          var vLastAlert = -1;

          //}}EFSWizard_Declarations 31593


          function preMain() {
          /**
          * This function is called only once, before any of the bars are loaded.
          * Place any study or EFS configuration commands here.
          */
          //{{EFSWizard_PreMain
          setPriceStudy(false);
          setStudyTitle("4MACD");
          setCursorLabelName("HISTbl", 0);
          setCursorLabelName("HISTrd", 1);
          setCursorLabelName("HISTgr", 2);
          setCursorLabelName("HISTyl", 3);
          setDefaultBarStyle(PS_SOLID, 0);
          setDefaultBarStyle(PS_SOLID, 1);
          setDefaultBarStyle(PS_SOLID, 2);
          setDefaultBarStyle(PS_SOLID, 3);
          setDefaultBarFgColor(Color.blue, 0);
          setDefaultBarFgColor(Color.red, 1);
          setDefaultBarFgColor(Color.green, 2);
          setDefaultBarFgColor(Color.yellow, 3);
          setDefaultBarThickness(4, 0);
          setDefaultBarThickness(4, 1);
          setDefaultBarThickness(4, 2);
          setDefaultBarThickness(4, 3);
          setPlotType(PLOTTYPE_HISTOGRAM, 0);
          setPlotType(PLOTTYPE_HISTOGRAM, 1);
          setPlotType(PLOTTYPE_HISTOGRAM, 2);
          setPlotType(PLOTTYPE_HISTOGRAM, 3);
          //}}EFSWizard_PreMain 100940

          }

          function main() {
          /**
          * The main() function is called once per bar on all previous bars, once per
          * each incoming completed bar, and if you don't have 'setComputeOnClose(true)'
          * in your preMain(), it is also called on every tick.
          */

          //{{EFSWizard_Expressions
          //{{EFSWizard_Expression_1
          if (

          //Error is on this line// vMACD17_14.getValue(MACDStudy.HIST) < &&

          vMACD17_8.getValue(MACDStudy.HIST) < &&
          vMACD5_10.getValue(MACDStudy.HIST) < &&
          vMACD10_16.getValue(MACDStudy.HIST) <
          ) onAction1();
          //}}EFSWizard_Expression_1 27679

          //}}EFSWizard_Expressions 40582


          //{{EFSWizard_Return
          return new Array(
          vMACD17_14.getValue(MACDStudy.HIST),
          vMACD17_8.getValue(MACDStudy.HIST),
          vMACD5_10.getValue(MACDStudy.HIST),
          vMACD10_16.getValue(MACDStudy.HIST)
          );
          //}}EFSWizard_Return 23781

          }

          function postMain() {
          /**
          * The postMain() function is called only once, when the EFS is no longer used for
          * the current symbol (ie, symbol change, chart closing, or application shutdown).
          */
          }

          //{{EFSWizard_Actions
          //{{EFSWizard_Action_1
          function onAction1() {
          vLastAlert = 1;
          }
          //}}EFSWizard_Action_1 5589

          //}}EFSWizard_Actions 15622


          vMACD17_14.getValue(MACDStudy.HIST) < &&

          Comment


          • #6
            jouster

            From your comment it seemed you were suggesting I combine all 4 in one formula correct?

            That is correct.

            I wasn't quite sure what to do with the 'if/then' arguments...

            That whole section of the Wizard should be left blank as you have no specific conditions that you want to verify. All you need to do is declare the studies in the Studies Used section and set them up to plot in the Returned Data Points section.
            Contrary to what I originally said the order should be 17/8/5, 17/14/7, 5/10/5 and last 10/16/5.
            Alex

            Comment


            • #7
              4MACD

              Thanks Alexis,

              The order of MACD entries you suggested does work best and I was able to use the formula wizard to create the 4MACD! My first successful use of the wizard. I've posted a chart showing the result and will attempt in a second post to attach the .efs.

              For other readers: The Cummings system used a Wilder RSI and a TS2000 indicator similar to On Balance Volume overlayed on the 4MACD, plus stochastics to indicate entries/exits. One can also use it in conjunction with the Ergotic TS-2, Get 6/4 to confirm trend breakouts.

              If anyone finds other indicator combos with the 4MACD I'd be happy to hear about it.
              Lon
              Attached Files

              Comment


              • #8
                4MACD formula

                Here's the formula for the four overlayed MACD's used in the Cummings indicator.

                Lon
                Attached Files

                Comment

                Working...
                X