Announcement

Collapse
No announcement yet.

Help with a study

Collapse
X
 
  • Filter
  • Time
  • Show
Clear All
new posts

  • #16
    Mov Roc Ma

    Doug:

    Thanks for the reply. The specific indicator I am working with is attached below. It is a moving average of the rate of change of a moving average. However when you plot it you will notice that it lags (or doesn't print) the last 14 bars on the chart. It is a simplified version of the KST formula by Pring. I have the Metastock formulas, but cannot locate an E-signal version. The attached EFS would be fine, if the indicator plotted up to the curent bar. Any thoughts would be greatly appreciated...

    Steve
    Attached Files

    Comment


    • #17
      Hi Jones

      OK, I plotted the indicator and I see what you mean. However, I'm not sure that it is "lagging" the last 14 bars. It appears to have a negative displacement. By eye, it certainly appears to be tracking price but when compared to price or a standard MACD, its plot appears to be displaced backwards. Unfortunately, I can't confirm as there is no realtime data being plotted right now. I think you should run it by Alex and see what she says.

      Sorry I couldn't be of more assistance.

      RGDS
      Doug

      Comment


      • #18
        Mov Roc Ma

        Thanks for the help. I agree, it appears displaced, but I can't seem to see anything like that in the script. I will run it by Alex as soon as she becomes available to take a look.

        Steve

        Comment


        • #19
          Steve, Doug
          In creating the arrays vROC6, vROC10, etc you are using future values (IOW shifting the studies backwards) by using positive bar index values in the functions roc6.getValue(ROCStudy.ROC,0,10); or roc10.getValue(ROCStudy.ROC,0,10); etc instead of negative values ie roc6.getValue(ROCStudy.ROC,0,-10); or roc10.getValue(ROCStudy.ROC,0,-10);, etc
          Alex

          Comment


          • #20
            Got it.

            Thanks Alex

            Comment


            • #21
              Steve
              With regards to painting the bars in blue or red if the indicator is above/below 0 you will need to first create a local variable (called for example vRet) in which you insert the expression you have in the return statement. Then you use that variable in your conditions ie
              if(vRet>0)
              setPriceBarColor(Color.lime);

              etc.
              You will also need to add two statements in preMain ie
              setColorPriceBars(true);
              setDefaultPriceBarColor(Color.black);//or color of your choice

              Lastly replace the expression in the return statement with vRet (or whatever name you used for the variable)
              Alex

              Comment


              • #22
                Thanks Alex - your explanation made sense with regard to future values. Was hoping that wasn't the case. As far as the paintbars, I tried to do as you explained but couldn't get it to work. I think I have the return statement screwed up. Can you see where I went wrong? Thanks for all your help. It is really appreciated.

                Steve


                /************************************************** *******
                Alexis C. Montenegro © April 2003
                Use and/or modify this code freely. If you redistribute it
                please include this and/or any other comment blocks and a
                description of any changes you make.
                ************************************************** ********/

                var vMA = null;
                var vROCofMA = null;
                var vRet = null;
                function preMain() {

                setStudyTitle("ROCofMA");
                setCursorLabelName("ROCofMA", 0);
                setDefaultBarFgColor(Color.blue, 0);
                addBand(0,PS_SOLID,3,Color.black);
                setColorPriceBars(true);
                setDefaultPriceBarColor(Color.black);
                checkVersion(1,"http://share.esignal.com/ContentRoot/ACM%20Test/Formulas/ROCofMA.efs"); //Comment this line out if modifying the code

                var fp1 = new FunctionParameter("MALength", FunctionParameter.NUMBER);
                fp1.setLowerLimit(1);
                fp1.setDefault(20); //Edit this value to set a new default

                var fp2 = new FunctionParameter("MAOffset", FunctionParameter.NUMBER);
                fp2.setDefault(0); //Edit this value to set a new default

                var fp3 = new FunctionParameter("MASource", FunctionParameter.STRING);
                fp3.setName("Source");
                fp3.addOption("Close");
                fp3.addOption("High");
                fp3.addOption("Low");
                fp3.addOption("Open");
                fp3.addOption("HL/2");
                fp3.addOption("HLC/3");
                fp3.addOption("OHLC/4");
                fp3.setDefault("Close"); //Edit this value to set a new default

                var fp4 = new FunctionParameter("MAType", FunctionParameter.STRING);
                fp4.setName("MAType");
                fp4.addOption("MAStudy.SIMPLE");
                fp4.addOption("MAStudy.EXPONENTIAL");
                fp4.addOption("MAStudy.WEIGHTED");
                fp4.addOption("MAStudy.VOLUMEWEIGHTED");
                fp4.setDefault("MAStudy.SIMPLE"); //Edit this value to set a new default

                var fp5 = new FunctionParameter("ROCLength", FunctionParameter.NUMBER);
                fp5.setLowerLimit(1);
                fp5.setDefault(10); //Edit this value to set a new default
                }

                function main(MALength,MAOffset,MASource,MAType,ROCLength) {

                if (vMA == null) vMA = new MAStudy(MALength, MAOffset, MASource, eval(MAType));
                if (vROCofMA == null) vROCofMA = new ROCStudy(ROCLength, vMA, MAStudy.MA);
                if(vRet>0)
                setPriceBarColor(Color.blue);
                if(vRet<0)
                setPriceBarColor(Color.red);


                /******************************************
                Insert your code following this text block
                Use vROCofMA.getValue(ROCStudy.ROC)
                *******************************************/


                return vROCofMA.getValue(ROCStudy.ROC);
                return vret.getvalue;
                }

                Comment


                • #23
                  Steve

                  Was hoping that wasn't the case.

                  That can be resolved by using negative values as I indicate in my reply.

                  I tried to do as you explained but couldn't get it to work. I think I have the return statement screwed up. Can you see where I went wrong?

                  My suggestions regarding painting the price bars were referencing the formula you originally posted in which the return statement was return (Sum6 / 10 + (Sum10 / 10) * 2 + (Sum15 / 8) * 3 + (Sum20 / 15) * 4);.
                  Alex

                  Comment


                  • #24
                    Alex:

                    Yes, I had originally wanted to use the formula you referred too, however, the 14 period "future values - or lag" you identifed render that formula moot for bar coloring; hence, I want to color the bars on the most recent formula I posted. I have tried following your instructions but do not quite have a grasp on the fine intracacies of the language. Can you see where I went wrong in my most recent formula posted for changing bar colors. I do appreciate your help, and am trying to learn the language asap. Thanks,

                    Steve

                    Comment


                    • #25
                      Steve

                      See the attached EFS for your original version without the lag. You should see if Alex can help you add a signal line and color the bars which is what I think you're after.

                      Rgds
                      Doug
                      Attached Files

                      Comment


                      • #26
                        Thanks Doug - that certainly helps. Problem is I am trying to duplicate the zero line crosses on that formula (Mov Roc Ma) and when I plot the recent roc ma 2 you posted - the zero line crosses are still off by quite a bit. Plot both on the same chart and you'll see what I mean. Any more ideas would be wonderful.

                        Steve

                        Comment


                        • #27
                          Steve
                          Enclosed is a corrected version of the second formula. Notice that the changes required to paint the bars are the same as I suggested for the first script
                          With regards to learning the language I would strongly suggest that you use the Formula Wizard where possible (such as is in this case.) This will better help you understand the syntax and constructs required by the language and will make it easier to transition to using the Editor to write your own scripts. I would also suggest that you go through the EFS KnowledgeBase and in particulr the Help Guides sections
                          Alex

                          PHP Code:
                          /*********************************************************
                          Alexis C. Montenegro © April 2003                         
                          Use and/or modify this code freely. If you redistribute it
                          please include this and/or any other comment blocks and a 
                          description of any changes you make.                      
                          **********************************************************/

                          var vMA null;
                          var 
                          vROCofMA null;
                          var 
                          vRet null;
                          function 
                          preMain() {

                          setStudyTitle("ROCofMA");
                          setCursorLabelName("ROCofMA"0);
                          setDefaultBarFgColor(Color.blue0);
                          addBand(0,PS_SOLID,3,Color.black);
                          setColorPriceBars(true);
                          setDefaultPriceBarColor(Color.black);

                          var 
                          fp1 = new FunctionParameter("MALength"FunctionParameter.NUMBER);
                          fp1.setLowerLimit(1); 
                          fp1.setDefault(20); //Edit this value to set a new default

                          var fp2 = new FunctionParameter("MAOffset"FunctionParameter.NUMBER);
                          fp2.setDefault(0); //Edit this value to set a new default

                          var fp3 = new FunctionParameter("MASource"FunctionParameter.STRING);
                          fp3.setName("Source");
                          fp3.addOption("Close");
                          fp3.addOption("High");
                          fp3.addOption("Low");
                          fp3.addOption("Open");
                          fp3.addOption("HL/2");
                          fp3.addOption("HLC/3");
                          fp3.addOption("OHLC/4");
                          fp3.setDefault("Close"); //Edit this value to set a new default 

                          var fp4 = new FunctionParameter("MAType"FunctionParameter.STRING);
                          fp4.setName("MAType");
                          fp4.addOption("MAStudy.SIMPLE");
                          fp4.addOption("MAStudy.EXPONENTIAL");
                          fp4.addOption("MAStudy.WEIGHTED");
                          fp4.addOption("MAStudy.VOLUMEWEIGHTED");
                          fp4.setDefault("MAStudy.SIMPLE"); //Edit this value to set a new default

                          var fp5 = new FunctionParameter("ROCLength"FunctionParameter.NUMBER);
                          fp5.setLowerLimit(1); 
                          fp5.setDefault(10); //Edit this value to set a new default
                          }

                          function 
                          main(MALength,MAOffset,MASource,MAType,ROCLength) {

                          if (
                          vMA == nullvMA = new MAStudy(MALengthMAOffsetMASource, eval(MAType));
                          if (
                          vROCofMA == nullvROCofMA = new ROCStudy(ROCLengthvMAMAStudy.MA);

                          /******************************************
                          Insert your code following this text block 
                          Use vROCofMA.getValue(ROCStudy.ROC) 
                          *******************************************/


                          var vRet vROCofMA.getValue(ROCStudy.ROC);//creates a variable vRet and assigns
                                                                     // the vROCofMA value to it
                          //section moved from above
                          if(vRet>0
                          setPriceBarColor(Color.blue);
                          if(
                          vRet<0
                          setPriceBarColor(Color.red);

                          return 
                          vRet;//replaced return with vRet

                          Comment


                          • #28
                            Steve

                            Problem is I am trying to duplicate the zero line crosses on that formula (Mov Roc Ma) and when I plot the recent roc ma 2 you posted - the zero line crosses are still off by quite a bit

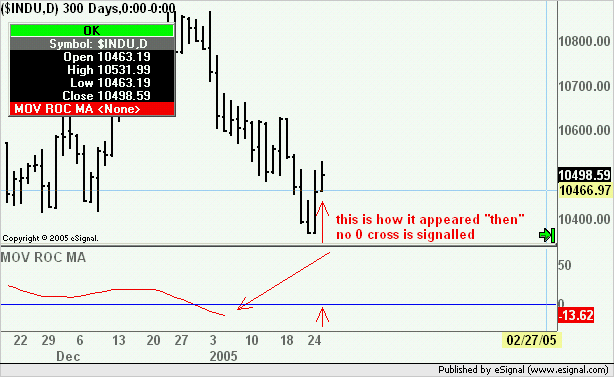
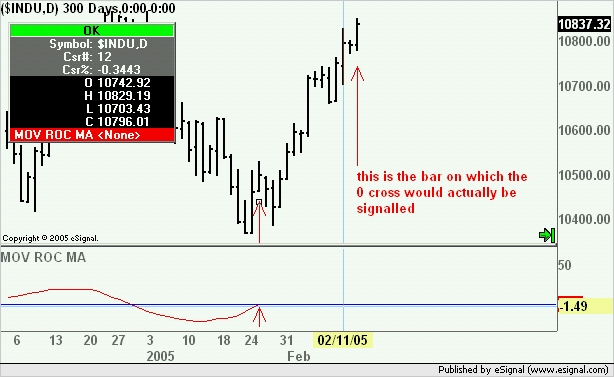
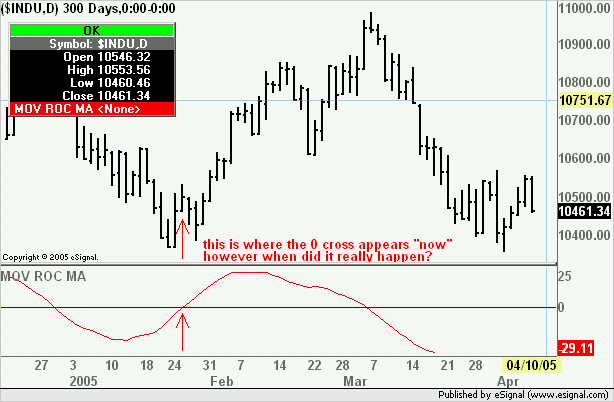
                            That is because in the original formula the historical plot is based on the knowledge of future events.
                            In the following sequence you can see how the events would unfold in real time with the original formula
                            Alex


                            Comment

                            Working...
                            X