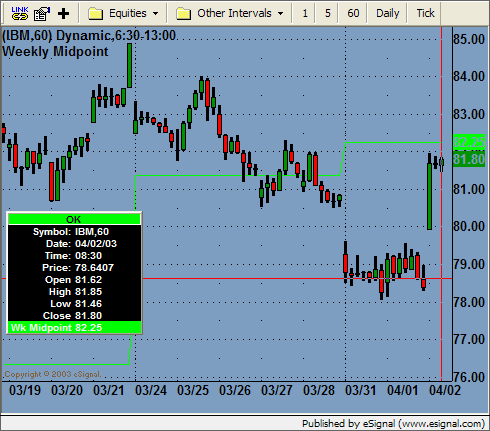
Hi, I wondering has anyone done this before (I looked in the old posts and couldnt find anything).
I'm looking to apply several/many horizontal lines on my advanced charts, with a common gap between them, say at 1 point intervals. eg Starting at 800 on the S&P,place a line there, then the next at 801, next at 802 etc etc going horizontally.
I guess the data/price point to start off with could be manual (ie typed in the program), but it would be great if I could place the start point by cursor and/or move that point around-but perhaps I'm pushing the bounds of reality too far!!
Anyway, any suggestions would be greatly received
John

Comment