Announcement

Collapse
No announcement yet.

Can't locate an efs for buying /selling pressure based on block trades at bid/ask

Collapse
X
 
  • Filter
  • Time
  • Show
Clear All
new posts

  • Can't locate an efs for buying /selling pressure based on block trades at bid/ask

    Hello,
    I'd like to create an efs that would create a 'bar type' indicator at the bottom of an advanced chart. I'd like it to track whether block trades (that could be customized in the efs to be, for ex. 2000 share or greater trades for a stock, or at 3000 share or greater trades for a different stock.)
    I'd like the efs to track whether these block trades are going through at the bid, or at the ask. So, if more are going through at the ask, it would be buying pressure, and the bar would be green; and conversely, if more are going at the bid, then it would be classified selling pressure and the bar would be red.
    I've tried searching using different keywords but haven't yet turned up anything like this. And the bar would measure the net # share for that time frame (ie if a 5 min chart, a bar for each 5 min period).
    Is there something like this/ Can something like this be set up?
  • #2
    Hello TraderJen,

    The BidAskAnalysis.efs study should do what you need. Set the Trade Volume Filter parameter to 2000 and it will exclude trades below that number.
    Jason K.
    Project Manager
    eSignal - an Interactive Data company

    EFS KnowledgeBase
    JavaScript for EFS Video Series
    EFS Beginner Tutorial Series
    EFS Glossary
    Custom EFS Development Policy

    New User Orientation

    Comment


    • #3
      Thank you Jason! Trying it out now. :-)

      Comment


      • #4
        One last question, Jason, I have edited a couple of versions of this efs for various block size cut offs; and can't seem to get the study title display to change. (ie if I want to run 2 versions, one for cut off of 1000 size blocks, another for 5000 size blocks I want the study title to differentiate between the two.
        Can you advise which line will do that?

        /************************************************** ***************
        Provided By : eSignal (c) Copyright 2004
        Description: Bid/Ask Analysis

        Version 2.0

        Notes:
        *** 2.0 - 11/26/2004 ***
        - Added Trade Volume Filter. Trade Volume less than the Filter
        number will be excluded when Srouce is set to Volume.

        Formula Parameters: Defaults:
        Analysis Bar
        [Bar, Cumulative]
        Study Output Raw Data
        [Relative Percent, Raw Data]
        Source Volume
        [Tick, Volume]
        Trade Volume Filter 0
        Ask Color green
        Inside Color black
        Bid Color red
        Total Color lime
        Ask Thickness 8
        Inside Thickness 6
        Bid Thickness 4
        Display Ask Yes
        [Yes, No]
        Display Inside Yes
        [Yes, No]
        Display Bid Yes
        [Yes, No]
        Display Total Yes
        [Yes, No]
        ************************************************** ***************/

        function preMain() {
        setStudyTitle("Bid\/Ask Analysis 100,000 blocks and up ");
        setCursorLabelName("Total", 0);
        setCursorLabelName("Ask %", 1);
        setCursorLabelName("Inside %", 2);
        setCursorLabelName("Bid %", 3);
        setDefaultBarFgColor(Color.lime, 0);
        setDefaultBarFgColor(Color.green, 1);
        setDefaultBarFgColor(Color.black, 2);
        setDefaultBarFgColor(Color.red, 3);
        setDefaultBarThickness(8, 0);
        setDefaultBarThickness(8, 1);
        setDefaultBarThickness(6, 2);
        setDefaultBarThickness(4, 3);
        setPlotType(PLOTTYPE_HISTOGRAM, 0);
        setPlotType(PLOTTYPE_HISTOGRAM, 1);
        setPlotType(PLOTTYPE_HISTOGRAM, 2);
        setPlotType(PLOTTYPE_HISTOGRAM, 3);
        setShowTitleParameters(false);
        setStudyMin(0);

        var fp0 = new FunctionParameter("sType", FunctionParameter.STRING);
        fp0.setName("Analysis");
        fp0.addOption("Bar");
        fp0.addOption("Cumulative");
        fp0.setDefault("Bar");
        var fp1 = new FunctionParameter("sOutput", FunctionParameter.STRING);
        fp1.setName("Study Output");
        fp1.addOption("Relative Percent");
        fp1.addOption("Raw Data");
        fp1.setDefault("Raw Data");
        var fp2 = new FunctionParameter("sSource", FunctionParameter.STRING);
        fp2.setName("Source");
        fp2.addOption("Tick");
        fp2.addOption("Volume");
        fp2.setDefault("Volume");
        var fp2a = new FunctionParameter("nFilter", FunctionParameter.NUMBER);
        fp2a.setName("Trade Volume Filter");
        fp2a.setLowerLimit(100000);
        fp2a.setDefault(100000);
        var fp3 = new FunctionParameter("cAsk", FunctionParameter.COLOR);
        fp3.setName("Ask Color");
        fp3.setDefault(Color.green);
        var fp4 = new FunctionParameter("cInside", FunctionParameter.COLOR);
        fp4.setName("Inside Color");
        fp4.setDefault(Color.black);
        var fp5 = new FunctionParameter("cBid", FunctionParameter.COLOR);
        fp5.setName("Bid Color");
        fp5.setDefault(Color.red);
        var fp6 = new FunctionParameter("cTotal", FunctionParameter.COLOR);
        fp6.setName("Total Color");
        fp6.setDefault(Color.lime);
        var fp7 = new FunctionParameter("nAskThickness", FunctionParameter.NUMBER);
        fp7.setName("Ask Thickness");
        fp7.setDefault(8);
        var fp8 = new FunctionParameter("nInsideThickness", FunctionParameter.NUMBER);
        fp8.setName("Inside Thickness");
        fp8.setDefault(6);
        var fp9 = new FunctionParameter("nBidThickness", FunctionParameter.NUMBER);
        fp9.setName("Bid Thickness");
        fp9.setDefault(4);
        var fp10 = new FunctionParameter("sAskDisplay", FunctionParameter.STRING);
        fp10.setName("Display Ask");
        fp10.addOption("Yes");
        fp10.addOption("No");
        fp10.setDefault("Yes");
        var fp11 = new FunctionParameter("sInsideDisplay", FunctionParameter.STRING);
        fp11.setName("Display Inside");
        fp11.addOption("Yes");
        fp11.addOption("No");
        fp11.setDefault("Yes");
        var fp12 = new FunctionParameter("sBidDisplay", FunctionParameter.STRING);
        fp12.setName("Display Bid");
        fp12.addOption("Yes");
        fp12.addOption("No");
        fp12.setDefault("Yes");
        var fp13 = new FunctionParameter("sTotalDisplay", FunctionParameter.STRING);
        fp13.setName("Display Total");
        fp13.addOption("Yes");
        fp13.addOption("No");
        fp13.setDefault("Yes");
        }

        var nAsk = null;
        var nBid = null;
        var nMax = 0;
        var aReturn = new Array(4); // return array;

        // Volume
        var nBidVol = 0;
        var nInsideVol = 0;
        var nAskVol = 0;
        var nTotalVol = 0;
        var vVol = null;
        var bPrimed = false;

        // Tick
        var nBidTick = 0;
        var nInsideTick = 0;
        var nAskTick = 0;
        var nTotalTick = 0;

        var bEdit = true;

        function main(sType, sOutput, sSource, nFilter, cAsk, cInside, cBid,
        nAskThickness, nInsideThickness, nBidThickness,
        sAskDisplay, sInsideDisplay, sBidDisplay, sTotalDisplay) {
        if (getCurrentBarIndex() < 0) return;

        if (bEdit == true) {
        setStudyTitle("Bid\/Ask " + sOutput + ": " + sSource + " (" + sType + ")");
        setDefaultBarFgColor(cAsk, 1);
        setDefaultBarFgColor(cInside, 2);
        setDefaultBarFgColor(cBid, 3);
        setDefaultBarThickness(nAskThickness, 1);
        setDefaultBarThickness(nInsideThickness, 2);
        setDefaultBarThickness(nBidThickness, 3);
        setDefaultBarThickness(Math.max(nAskThickness, nInsideThickness, nBidThickness), 0);
        if (sOutput == "Raw Data") {
        setCursorLabelName("Ask Total", 1);
        setCursorLabelName("Inside Total", 2);
        setCursorLabelName("Bid Total", 3);
        removeBand("0");
        removeBand("25");
        removeBand("50");
        removeBand("75");
        removeBand("100");
        nMax = 0;
        } else { // Percent
        setCursorLabelName("Ask %", 1);
        setCursorLabelName("Inside %", 2);
        setCursorLabelName("Bid %", 3);
        addBand(0, PS_SOLID, 1, Color.black, "0");
        addBand(25, PS_SOLID, 1, Color.black, "25");
        addBand(50, PS_SOLID, 1, Color.black, "50");
        addBand(75, PS_SOLID, 1, Color.black, "75");
        addBand(100, PS_SOLID, 1, Color.black, "100");
        setStudyMax(115);
        }
        bEdit = false;
        }

        var nState = getBarState();

        if (nState == BARSTATE_NEWBAR && getDay(0) != getDay(-1)) nMax = 0;

        if (sSource == "Volume") {
        if (nState == BARSTATE_NEWBAR) {
        vVol = 0;
        if (sType == "Bar" || getDay(0) != getDay(-1)) {
        nBidVol = 0;
        nInsideVol = 0;
        nAskVol = 0;
        vVol = 0;
        nTotalVol = 0;
        }
        }

        var vPrevVol = 0;
        if (vVol != 0 && bPrimed == true) vPrevVol = vVol;

        var nTempAsk = getMostRecentAsk();
        var nTempBid = getMostRecentBid();
        if (nTempAsk != null && nTempAsk != 0) nAsk = nTempAsk;
        if (nTempBid != null && nTempBid != 0) nBid = nTempBid;
        var vClose = close();
        vVol = volume();

        var vTradeVol = vVol - vPrevVol;
        if (vTradeVol < nFilter) return aReturn;

        if (bPrimed == false && vVol != null) {
        bPrimed = true;
        return;
        } else {
        nTotalVol += vTradeVol;
        if (vClose <= nBid) {
        nBidVol += vTradeVol;
        } else if (vClose >= nAsk) {
        nAskVol += vTradeVol;
        } else {
        nInsideVol += vTradeVol;
        }
        }
        } else if (sSource == "Tick") {
        if (nState == BARSTATE_NEWBAR) {
        if (sType == "Bar" || getDay(0) != getDay(-1)) {
        nBidTick = 0;
        nInsideTick = 0;
        nAskTick = 0;
        nTotalTick = 0;
        }
        }

        var nTempAsk = getMostRecentAsk();
        var nTempBid = getMostRecentBid();
        if (nTempAsk != null && nTempAsk != 0) nAsk = nTempAsk;
        if (nTempBid != null && nTempBid != 0) nBid = nTempBid;
        var vClose = close();

        nTotalTick++;
        if (vClose <= nBid) {
        nBidTick++;
        } else if (vClose >= nAsk) {
        nAskTick++;
        } else {
        nInsideTick++;
        }
        }

        // Return Data
        var nDtotal;
        var nDask;
        var nDinside;
        var nDbid;
        if (sSource == "Volume") {
        if (sOutput == "Relative Percent") {
        nDtotal = 100; if (sTotalDisplay == "No") nDtotal = nDtotal+"";
        nDask = (nAskVol/nTotalVol)*100; if (sAskDisplay == "No") nDask = nDask.toFixed(4);
        nDinside = (nInsideVol/nTotalVol)*100; if (sInsideDisplay == "No") nDinside = nDinside.toFixed(4);
        nDbid = (nBidVol/nTotalVol)*100; if (sBidDisplay == "No") nDbid = nDbid.toFixed(4);
        //return new Array(100, (nAskVol/nTotalVol)*100, (nInsideVol/nTotalVol)*100, (nBidVol/nTotalVol)*100);
        } else if (sOutput == "Raw Data") {
        nMax = Math.max(nMax, nTotalVol);
        setStudyMax(nMax);
        nDtotal = nTotalVol; if (sTotalDisplay == "No") nDtotal = nDtotal+"";
        nDask = nAskVol; if (sAskDisplay == "No") nDask = nDask.toFixed(4);
        nDinside = nInsideVol; if (sInsideDisplay == "No") nDinside = nDinside.toFixed(4);
        nDbid = nBidVol; if (sBidDisplay == "No") nDbid = nDbid.toFixed(4);
        //return new Array(nTotalVol, nAskVol, nInsideVol, nBidVol);
        }
        } else if (sSource == "Tick") {
        if (sOutput == "Relative Percent") {
        nDtotal = 100; if (sTotalDisplay == "No") nDtotal = nDtotal+"";
        nDask = (nAskTick/nTotalTick)*100; if (sAskDisplay == "No") nDask = nDask.toFixed(4);
        nDinside = (nInsideTick/nTotalTick)*100; if (sInsideDisplay == "No") nDinside = nDinside.toFixed(4);
        nDbid = (nBidTick/nTotalTick)*100; if (sBidDisplay == "No") nDbid = nDbid.toFixed(4);
        //return new Array(100, (nAskTick/nTotalTick)*100, (nInsideTick/nTotalTick)*100, (nBidTick/nTotalTick)*100);
        } else if (sOutput == "Raw Data") {
        nMax = Math.max(nMax, nTotalTick);
        setStudyMax(nMax);
        nDtotal = nTotalTick; if (sTotalDisplay == "No") nDtotal = nDtotal+"";
        nDask = nAskTick; if (sAskDisplay == "No") nDask = nDask.toFixed(4);
        nDinside = nInsideTick; if (sInsideDisplay == "No") nDinside = nDinside.toFixed(4);
        nDbid = nBidTick; if (sBidDisplay == "No") nDbid = nDbid.toFixed(4);
        //return new Array(nTotalTick, nAskTick, nInsideTick, nBidTick);
        }
        }

        aReturn[0] = nDtotal;
        aReturn[1] = nDask;
        aReturn[2] = nDinside;
        aReturn[3] = nDbid;
        return new Array(nDtotal, nDask, nDinside, nDbid);
        }

        Comment


        • #5
          Hello TradeJen,

          The setStudyTitle() function is the correct function to modify to change the title. This particular study also calls the setStudyTitle() function inside a "bEdit" routine in main(), so you'll need to change those as well. The call in main() is overriding the change you made in preMain().

          Look for the following line in main,
          setStudyTitle("Bid\/Ask " + sOutput + ": " + sSource + " (" + sType + ")");

          ... and change it to:
          setStudyTitle("Bid\/Ask 100,000 blocks and up " + sOutput + ": " + sSource + " (" + sType + ")");
          Jason K.
          Project Manager
          eSignal - an Interactive Data company

          EFS KnowledgeBase
          JavaScript for EFS Video Series
          EFS Beginner Tutorial Series
          EFS Glossary
          Custom EFS Development Policy

          New User Orientation

          Comment


          • #6
            Hi Jason,
            Thanks for the help! That took care of the study title.
            One other things I am trying to uncover; I've noticed the efs (the one I've set for 2,000 block minimum) will show a block of 2,500 for time periods after the actual block transaction went through. For ex; on FC today, at 10:52am est, a block went through of 2,800 (total shares for that miniute was 3,200) However, the next minute with a trade going through also shows a block of 2,800 in the efs; while the total sales for that minute, 10:55am est was only 500 shares. This discrepancy also applies for the next minutes with sales; 10:57am 300 shares; and 9:59am 1,700 shares total traded. (Yet the efs study still shows the same green bar of 2,800.) Hope that explanation is clear.
            Can you see anything in the efs as previously posted that would cause that? I would have expected the efs study bid/ask would have no bar, green nor red etc, for those subsequent minute timeframes where there wasn't a block transaction of 2,000 shares or greater. Thanks again!

            Comment


            • #7
              Hello Jason,

              can the bidask.efs or the 1 below, be changed to measure up volume (color greenn) down volume (red). If this is possible then what changes r needed. Ran a search with no result

              Peter

              Comment


              • #8
                Hello TraderJen,

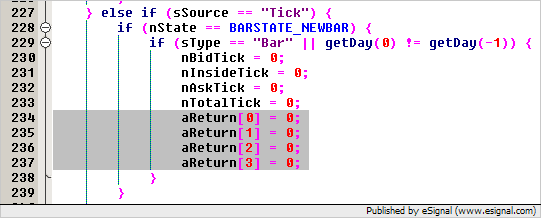
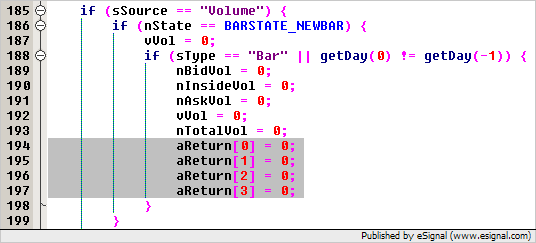
                I found the problem and will post the corrected version to the EFS Library shortly. The totals were not being reset properly when the filter was being used. Thank you for reporting the issue. If you want to make the correction to your custom version, you just need to add the following 4 lines at two locations.

                aReturn[0] = 0;
                aReturn[1] = 0;
                aReturn[2] = 0;
                aReturn[3] = 0;

                Here's where you need to add them.


                Jason K.
                Project Manager
                eSignal - an Interactive Data company

                EFS KnowledgeBase
                JavaScript for EFS Video Series
                EFS Beginner Tutorial Series
                EFS Glossary
                Custom EFS Development Policy

                New User Orientation

                Comment


                • #9
                  Hello Peter,

                  Modifying the BidAskAnalysis.efs may not be the way to go depending on how you are defining "up" and "down" volume. It may require a new formula altogether. Give me a more detailed description of how you would mathematically define the volume figures you're after. There has been a lot of volume studies coded out there. There's a good chance what you are looking for already exists.
                  Jason K.
                  Project Manager
                  eSignal - an Interactive Data company

                  EFS KnowledgeBase
                  JavaScript for EFS Video Series
                  EFS Beginner Tutorial Series
                  EFS Glossary
                  Custom EFS Development Policy

                  New User Orientation

                  Comment


                  • #10
                    Jason,

                    I would like to display net buying volume (displayed in green) & net selling (red). Nereus posted this eld file from TS.

                    Peter
                    Attached Files

                    Comment

                    Working...
                    X