Announcement

Collapse
No announcement yet.

Multiple time Frames

Collapse
This topic is closed.
X
X
 
  • Filter
  • Time
  • Show
Clear All
new posts

  • Multiple time Frames

    Good Morning,

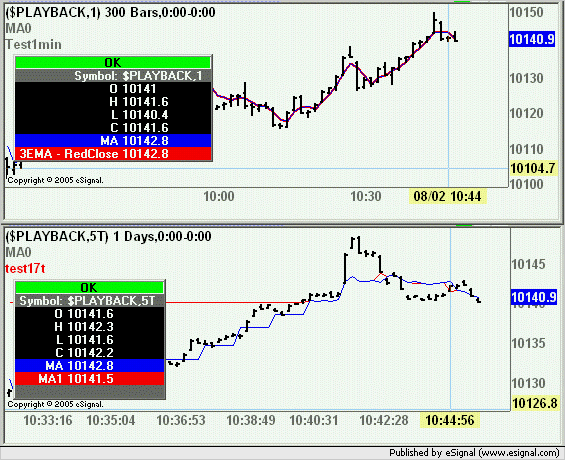
    I have searched the data base and not found an example of an EFS where there are two different moving averages of different time frames such as a x period average of the 10 minute data plotted over the y period moving average of 50 tick data plotted on 50 tick chart.

    Is an example available?

    Best regards,

    Alan

  • #2
    Hello Alan,

    The EFS2 built-in studies have optional sym() and inv(), which are used to create the multiple time frame study. If the study is based on the same symbol as your chart, just pass the interval to the inv() function like so.

    return ema(10, inv(10));

    If you want to base the moving average on an external symbol as well, pass the combination of the symbol and interval with the sym() function.

    return ema(10, sym("INTC,10"));

    You can apply either example to a 50T chart.
    Jason K.
    Project Manager
    eSignal - an Interactive Data company

    EFS KnowledgeBase
    JavaScript for EFS Video Series
    EFS Beginner Tutorial Series
    EFS Glossary
    Custom EFS Development Policy

    New User Orientation

    Comment


    • #3
      Time Frames

      Jason,

      Thank you for the guidance.

      I shall work on this over the long weekend.

      As always, Your Help Is Greatly Appreciated.

      Best Regards,

      Alan

      Comment


      • #4
        time frames

        Jason,

        what is the format for tick, minute, day, etc. for the inv() function when the plot is on a chart of a different time frame?

        Best regards,

        Alan

        Comment


        • #5
          Hello Alan,

          Any interval that contains a letter needs to be a string.

          inv("D");
          inv("100T");

          Any interval that is just a number can be a string or a constant.

          inv("5");
          inv(5);
          Jason K.
          Project Manager
          eSignal - an Interactive Data company

          EFS KnowledgeBase
          JavaScript for EFS Video Series
          EFS Beginner Tutorial Series
          EFS Glossary
          Custom EFS Development Policy

          New User Orientation

          Comment


          • #6
            Times

            Jason,

            Thank you the clarification.

            I am using the Custom EFS2 moving average in 7.9 written by Alex. How do I add this time frame specification into this code to allow me to specify the type, offset, etc. along with the inv()?

            Best Regards,

            Alan

            Comment


            • #7
              Alan
              The efs is already set up to accept any interval (numeric or alphanumeric) you may want to pass through Edit Studies. Also in Edit Studies you can select the type of average, source, symbol (if different form the one being charted), offset, etc
              Alex

              Comment


              • #8
                time frame

                Alex,

                Thank you for your responce.

                I do not see the inv() function in the code. I am not familiar with the edit study approach. Could you please advise how I do that to modify the inv() function?

                Best regards,

                Alan

                Comment


                • #9
                  Alan
                  Right click the chart select Edit Studies and then the MA Study and you will see that one of the user definable variables is Interval. Type in the interval you wish and the efs will compute the average based on that interval.
                  In the script itself I did not use the inv() function but the sym() function which can include inv() (see Jason's sym() link in this reply to you) so as to provide maximum flexibility to the efs.
                  Alex

                  Comment


                  • #10
                    Time Frame

                    Alex,

                    As always; your assistance is greatly appreciated.

                    Have a great weekend.

                    Best regards,

                    Alan

                    Comment


                    • #11
                      time frams

                      Alex,

                      I have been testing 7.9 on a separate computer from 7.8. On 7.8 i passed a 3 period moving average of 1 minute variable using set/get global variables to a 17T chart. All works well.

                      When I duplicated this on the 7.9 it worked well. When I added your custom 1 interval moving average to the 17t chart to duplicate the global passing I get different results. It appears the global takes a reading of the current status of the 1 minute chart when the 17T point is completed and therefore I get extra 1 minute data points assuming there are several 17T inside a 1 minute period. The 7.9 interval appears to pass only 1 data point to the 17T chart and syncs the plot to the tick that contains the exact minute ending. Is this correct?

                      Is there a way to use the interval function to duplicate the global in 7.8 where I get the extra data points?

                      Is there way in 7.9 such as the series commands that I can store the passed global data so if I reload the efs I do not lose the old data like in 7.8?

                      Best regards,

                      Alan

                      Comment


                      • #12
                        Alan

                        The 7.9 interval appears to pass only 1 data point to the 17T chart and syncs the plot to the tick that contains the exact minute ending. Is this correct?

                        Assuming I understood what you are saying then yes that is correct and is the behavior I would expect when dealing with true multiple time frames. .
                        However, if you want to see in real time the closing value of the external interval at every new bar of the main interval then return studyname.getValue(0) rather than getSeries(studyname). Note that if you reload the efs the historical data will be correctly syncronized once again
                        Having said this you also have the option of maintaining your efs1 syntax/construct in this specific instance.
                        Alex

                        Comment


                        • #13
                          Time frames

                          Alex,

                          Thank you for the suggestions. We are getting very close.

                          Attached is the sample code for the 3 period close MA of 1 minute data. This is passed out to the second EFS running a 17T chart. The third EFS is a copy of your custom MA with the real time collection of 1 minute interval. Most of the data from the two sources is identical, however there are periodic spikes where the data differs. Your guidance is greatly appreciated in resolving the differences.

                          Best Regards,

                          Alan

                          EFS1
                          PHP Code:
                          /*********************************************************
                          End moving average - 3 period - close
                          **********************************************************/

                          var vMA1 null;
                          var 
                          vCntr 0;

                          function 
                          preMain() {

                              
                          setPriceStudy(true);
                              
                          setStudyTitle("Test1min");
                              
                          setCursorLabelName("3EMA - RedClose"0);
                              
                          setDefaultBarStyle(PS_SOLID0);
                              
                          setDefaultBarFgColor(Color.red0);
                              
                          setDefaultBarThickness(20);
                              
                          setPlotType(PLOTTYPE_LINE0);
                                 
                              
                              var 
                          fp1 = new FunctionParameter("MA1Length"FunctionParameter.NUMBER);
                              
                          fp1.setLowerLimit(1);        
                              
                          fp1.setDefault(3); //Edit this value to set a new default
                              
                              
                          var fp2 = new FunctionParameter("MA1Offset"FunctionParameter.NUMBER);
                              
                          fp2.setDefault(0); //Edit this value to set a new default
                              
                              
                          var fp3 = new FunctionParameter("MA1Source"FunctionParameter.STRING);
                              
                          fp3.setName("MA1Source");
                              
                          fp3.addOption("Close");
                              
                          fp3.addOption("High");
                              
                          fp3.addOption("Low");
                              
                          fp3.addOption("Open");
                              
                          fp3.addOption("HL/2");
                              
                          fp3.addOption("HLC/3");
                              
                          fp3.addOption("OHLC/4");
                              
                          fp3.setDefault("Close"); //Edit this value to set a new default     
                              
                              
                          var fp4 = new FunctionParameter("MA1Type"FunctionParameter.STRING);
                              
                          fp4.setName("MA1Type");
                              
                          fp4.addOption("MAStudy.SIMPLE");
                              
                          fp4.addOption("MAStudy.EXPONENTIAL");
                              
                          fp4.addOption("MAStudy.WEIGHTED");
                              
                          fp4.addOption("MAStudy.VOLUMEWEIGHTED");
                              
                          fp4.setDefault("MAStudy.SIMPLE"); //Edit this value to set a new default
                              
                              
                          var fp5 = new FunctionParameter("Centered"FunctionParameter.STRING);
                              
                          fp5.addOption("Yes");
                              
                          fp5.addOption("No");
                              
                          fp5.setDefault("No");
                              
                          }

                          function 
                          main(MA1Length,MA1Offset,MA1Source,MA1Type,Centered) {

                              if(
                          getBarState()==BARSTATE_NEWBAR){
                              
                          vCntr +=1;
                              }
                              if(
                          vCntr<MA1Length*2)
                              return;
                              
                              if(
                          Centered=="Yes"){    
                              var 
                          MA1Offset Math.ceil(MA1Length/2)*(-1);
                              }

                              if (
                          vMA1 == nullvMA1 = new MAStudy(MA1LengthMA1OffsetMA1Source, eval(MA1Type));
                                  
                          /******************************************
                          Insert code here
                          *******************************************/
                              
                              
                          if(getBarState() == BARSTATE_NEWBAR){
                                  var 
                          nNum 1;
                              }else{
                                  var 
                          nNum 0;
                              }
                              
                              var 
                          vReturn vMA1.getValue(MAStudy.MA,MA1Offset);
                              if (
                          vReturn == null) return;

                              if(
                          MA1Offset<0){
                                  if(
                          getBuildNumber() > 636){
                                      
                          setBar(Bar.Value,MA1Offset+nNum,0,vReturn);
                                      
                          vReturn=null;
                                  }else{
                                      
                          setBar(Bar.Value,MA1Offset+nNum,vMA1.getValue(MAStudy.MA,MA1Offset));
                                      
                          vReturn=null;
                                  }
                              }
                             if(
                          vReturn!=null)
                             
                          setGlobalValue("Outvar1",vReturn);
                             

                          return 
                          vReturn;


                          EFS2
                          PHP Code:
                          /*********************************************************
                          Pass through
                          **********************************************************/

                          function preMain() {
                              
                          setPriceStudy(true);
                              
                          setStudyTitle("test17t");
                              
                          setCursorLabelName("MA1"0);   
                              
                          setDefaultBarStyle(PS_SOLID0);
                              
                          setDefaultBarFgColor(Color.blue0);
                              
                          setDefaultBarThickness(30);
                              
                          setPlotType(PLOTTYPE_LINE0);
                              
                          setDefaultChartBG(vColor);    

                          }

                          function 
                          main() {

                          var 
                          x1 getGlobalValue("Outvar1");

                          return (
                          x1);   


                          EFS3
                          PHP Code:
                          /*********************************************************
                          By Alexis C. Montenegro for eSignal © December 2004       
                          Use and/or modify this code freely. If you redistribute it
                          please include this and/or any other comment blocks and a 
                          description of any changes you make.                      
                          **********************************************************/

                          var fpArray = new Array();

                          function 
                          preMain() {

                              
                          setPriceStudy(true);
                              
                          setStudyTitle("MA0");
                              
                          setCursorLabelName("MA",0);
                              
                          setDefaultBarFgColor(Color.blue,0);
                              
                          setPlotType(PLOTTYPE_LINE,0);
                              
                          setDefaultBarThickness(1,0);
                              
                          askForInput();

                              var 
                          x=0;
                              
                          fpArray[x] = new FunctionParameter("Type"FunctionParameter.STRING);
                              
                          with(fpArray[x++]){
                                  
                          addOption("sma");
                                  
                          addOption("ema");
                                  
                          addOption("wma");
                                  
                          addOption("vwma");
                                  
                          setDefault("sma");
                              }
                              
                          fpArray[x] = new FunctionParameter("Length"FunctionParameter.NUMBER);
                              
                          with(fpArray[x++]){
                                  
                          setLowerLimit(1);        
                                  
                          setDefault(3);
                              }
                              
                          fpArray[x] = new FunctionParameter("Source"FunctionParameter.STRING);
                              
                          with(fpArray[x++]){
                                  
                          addOption("open"); 
                                  
                          addOption("high");
                                  
                          addOption("low");
                                  
                          addOption("close");
                                  
                          addOption("hl2");
                                  
                          addOption("hlc3");
                                  
                          addOption("ohlc4"); 
                                  
                          setDefault("close"); 
                              }
                              
                          fpArray[x] = new FunctionParameter("Symbol"FunctionParameter.STRING);
                              
                          with(fpArray[x++]){
                                  
                          setDefault("");
                              }
                              
                          fpArray[x] = new FunctionParameter("Interval"FunctionParameter.NUMBER);
                              
                          with(fpArray[x++]){
                                  
                          setDefault("");
                              }
                              
                          fpArray[x] = new FunctionParameter("Offset"FunctionParameter.NUMBER);
                              
                          with(fpArray[x++]){
                                  
                          setDefault(0);
                              }
                              
                          fpArray[x] = new FunctionParameter("Params"FunctionParameter.BOOLEAN);
                              
                          with(fpArray[x++]){
                                  
                          setName("Show Parameters");
                                  
                          setDefault(false);
                              }
                          }

                          var 
                          bInit false;
                          var 
                          xMA null;

                          function 
                          main(Type,Length,Source,Symbol,Interval,Offset,Params) {

                              if(
                          bInit == false){
                                  if(
                          Symbol == nullSymbol getSymbol();
                                  if(
                          Interval == nullInterval getInterval();
                                  var 
                          vSymbol Symbol+","+Interval;
                                  
                          xMA offsetSeries(eval(Type)(Length,eval(Source)(sym(vSymbol))),Offset);
                                  
                          setShowTitleParameters(eval(Params));
                                  
                          bInit true;
                              }

                              return 
                          xMA.getValue(0);

                          Comment


                          • #14
                            Time Frame

                            Alex,

                            The following is a chart of the 17T with the thick line being the get variable and the thin line the interval function for the 1 minute moving average showing the occasional divergence.

                            You assistance is greatly appreciated.

                            Best Regards,

                            Alan
                            Attached Files

                            Comment


                            • #15
                              Alan
                              The solution you implemented with the EFS1 based studies does not provide true syncronization because it does not match the time stamps between intervals but relies instead only on relative bar indexes.
                              So, if for example a new bar forms on the higher interval chart the efs running in that chart will simply pass the value of the moving average to the lower interval chart even if a new bar with a corresponding time stamp has yet to be formed in the lower interval chart. In that instant the value of the moving average plotted on the lower interval chart is out of sync (as shown in the image below).
                              The EFS2 based studies instead maintain constant syncronization by matching time stamps between intervals
                              In the enclosed image the top chart is a 1 minute chart running your efs#1 (red plot) and efs#3 (blue plot). The bottom chart is a 5T chart with your efs#2 (red plot) and efs#3 (blue plot). As you can clearly see the efs#3 script is returning to the 5T chart the same exact value of the 1 minute chart while the efs#2 is instead returning an incorrect value.
                              Alex

                              Comment

                              Working...
                              X