Announcement

Collapse
No announcement yet.

Plot wide and narrow range bars

Collapse
X
 
  • Filter
  • Time
  • Show
Clear All
new posts

  • Plot wide and narrow range bars

    Hi,

    I want to create a formula in EFS that marks every bar with the following criteria:

    - This bar has the narrowest range of the last 10 bars;
    - This bar has the widest range of the last 10 bars.

    As you may recognize I´m new with EFS although I wrote this for TradeStation before.

    Hoping for help
    :-)
    is Harry
  • #2
    Harry
    The more common way to do it would be to use a for loop to determine the narrowest range in the last x bars and then check the current range against that. In the following example I use the for loop

    PHP Code:
    for(var i=0i<10i++){
            if(
    i==0){
                var 
    NarrowRng  high(-i)-low(-i);
                var 
    WideRng    high(-i)-low(-i)
            }else{
                
    NarrowRng  Math.min(NarrowRng, (high(-i)-low(-i)));
                
    WideRng    Math.max(WideRng, (high(-i)-low(-i)));
            }
        } 
    Then I create a variable called CurrentRng and check if it is equal to the narrowest/widest range of the last x bars in which case I color the price bar accordingly

    PHP Code:
    var CurrentRng high(0)-low(0);
        
        if(
    CurrentRng==NarrowRngsetPriceBarColor(Color.red);
        else if(
    CurrentRng==WideRngsetPriceBarColor(Color.lime); 
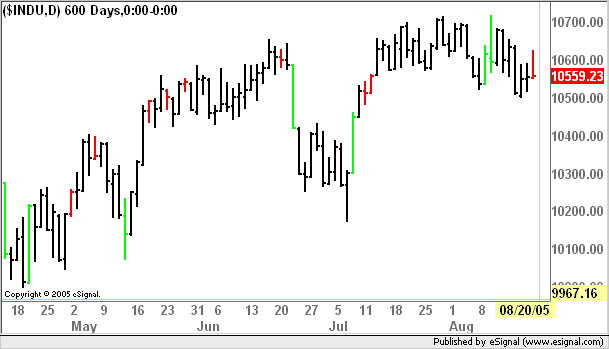
    In the image below you can see how this would display when used in an efs
    Alex

    Comment


    • #3
      Harry
      An easier way is to use the new EFS2 functions and specifically hhv(), llv() and efsInternal().
      For more information on efsInternal() see this thread. For information on all the EFS2 functions see the EFS KnowledgeBase under EFS2 Function Reference.
      In this case I would first create a separate function (within the same efs) called for example Range. Following is an example

      PHP Code:
      function Range(){
          return 
      high(0)-low(0);

      Then in function main I would call that function using efsInternal() (which will create a series) and then pass the series to the hhv() and llv() functions to determine the narrowest/widest range. Then as in the prior example I would just check the current range against those values. the result will be the same as shown in the image enclosed in the prior reply.
      Alex

      PHP Code:
      var Range efsInternal("Range");
          var 
      NarrowRng llv(10,Range);
          var 
      WideRng   hhv(10,Range);
          
          var 
      CurrentRng Range.getValue(0);
          
          if(
      CurrentRng==NarrowRng.getValue(0)) setPriceBarColor(Color.red);
          else if(
      CurrentRng==WideRng.getValue(0)) setPriceBarColor(Color.lime); 

      Comment


      • #4
        Dear Alexis,

        thanks a lot for your support. I pasted your second solution in 2 formulas, one called Range.efs and the other WR_NR10.efs and saved both. When in an advanced chart window I open (right-click, Formulas, WR_NR10) the formula, a new segment opens in the bottom of the page that is empty. Unfortunately this function shows itself separated from the price bars. What can I do to apply the formula to the price chart in the upper part of the window to get results like those you show in your answer?
        I also tried your first solution with the same results.

        Maybe it helps when I paste my whole formula:

        function main() {
        var Range = efsInternal("Range.efs");
        var NarrowRng = llv(10,Range);
        var WideRng = hhv(10,Range);

        var CurrentRng = Range.getValue(0);

        if(CurrentRng==NarrowRng.getValue(0)) setPriceBarColor(Color.yellow);
        else if(CurrentRng==WideRng.getValue(0)) setPriceBarColor(Color.white);

        }


        AND THE FIRST SOLUTION:

        function Main() {
        for(i=0; i<10; i++) {
        if(i==0) {
        var NarrowRange = high(-i)-low(-1);
        var WideRange = high(-i)-low(-i)
        }else{
        NarrowRange = Math.min(NarrowRange, (high(-i)-low(-i)));
        WideRange = Math.max(WideRange,(high(-i)-low(-i)));
        }
        }

        var CurrentRange = high(0)-low(0);
        if(CurrentRange==NarrowRange) setPriceBarColor(Color.yellow);
        else if(CurrentRange==WideRange) setPriceBarColor(Color.white);
        }

        Can you tell me where the mistake is?

        Harry

        Comment


        • #5
          Harry
          The first problem is that in both the solutions you implemented you are missing a function preMain() in which you would define the study as a price study using the setPriceStudy(true); statement ie

          PHP Code:
          function preMain(){
              
          setPriceStudy(true);
              
          //other statements if required such as study title etc added here

          By default if that statement is not present the efs is run as a non-price study ie in a separate pane.
          With regards instead to creating the Range function as a completely separate formula then you would be using the incorrect command to call it.
          Instead of efsInternal("Range"); you should be using efsExternal("Range.efs").
          At this point I would suggest reading through some of the Help Guides available in the EFS KnowledgeBase (see the link I provided in my prior reply) and in particular the Guide to Developing eSignal Indicators which will provide you with the basic information on the structure of an efs.
          In the EFS KnowledgeBase you will also find a complete guide to JavaScript 1.5 which is at the foundation of EFS (Esignal Formula Script)
          Hope this helps
          Alex

          Comment


          • #6
            Harry
            Adding to my prior reply. When painting price bars you will also need to add the following statements to preMain()
            Alex

            PHP Code:
            setColorPriceBars(true);
            setDefaultPriceBarColor(Color.yourcolor);//replace yourcolor with the color you want as the default price bar 

            Comment


            • #7
              Alex,
              Can you provide an EFS that shows the narrow range bars (nr7) that you show on the charts earlier in this thread? I tried to cut and paste and got error message. I have to import 3 or 4 narrow range bar EFS but none of them do what you show in your charting example.

              Comment

              Working...
              X