Announcement

Collapse
No announcement yet.

Lines at specific times

Collapse
X
 
  • Filter
  • Time
  • Show
Clear All
new posts

  • Lines at specific times

    Dear Alex,

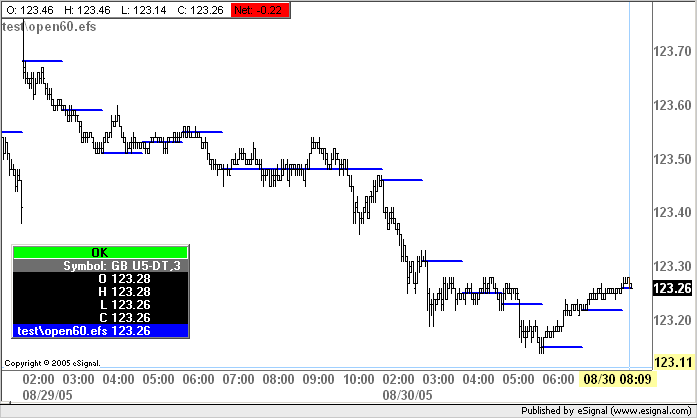
    I would like to draw a horizontal line from the opening of each hour like the chart shown here.

    This is my actual solution:

    if((getHour()*100)+getMinute()==1000) {A= open(0)};
    drawLineAbsolute( 0, A, 5, A, PS_SOLID, 1, Color.purple, "A");

    if((getHour()*100)+getMinute()==1100) {B= open(0)};
    drawLineRelative( 0, B, 5, B, PS_SOLID, 1, Color.purple, "B");


    The problem is, this code does not start and end the line in each hour.


    Can you solve this problem to code this?

    Thanks!

    Helmut
    Attached Files

  • #2
    Helmut
    In the Time Template create a User Defined 60 minute Interval with the appropriate Start/End Times after which all you need in your efs is
    var Open60 = open(0,inv(60));
    return Open60;

    If you want it to draw just the horizontal lines set the default plot type to PLOTTYPE_FLATLINES. In the image enclosed below you can see how it would display.
    Alex

    Comment


    • #3
      Alex,

      thank you. That´s what I was searching for.

      Helmut

      Comment


      • #4
        Alex,

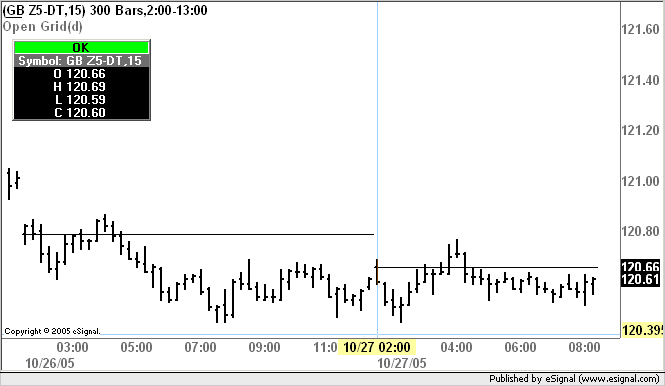
        please have a look at this code. It should display the open of a user specified timeframe.

        Using it in most timeframes is fine.


        function preMain()
        {
        setStudyTitle("Open Grid");
        setDefaultBarFgColor(Color.black,0);
        setDefaultBarThickness(1,0);
        setPlotType(PLOTTYPE_FLATLINES,0);
        setPriceStudy(true);
        setShowCursorLabel(false)

        var fp1 = new FunctionParameter("Intervall", FunctionParameter.NUMBER);
        fp1.setName("Intervall");
        fp1.setLowerLimit(1);
        fp1.setDefault(660);


        }


        function main(Intervall)
        {

        var OpenIntervall = open(0,inv(Intervall));


        return OpenIntervall

        }
        Attached Files

        Comment


        • #5
          But using the paramter 660 (whole Bund Future trading session) it does not work properly.
          Attached Files

          Comment


          • #6
            Helmut
            Remove the setLowerLimit() statement in the Function Parameter and in Edit Studies set the interval to D (or d).
            As far as I can see it works fine if you do it that way
            Alex

            Comment


            • #7
              Thanks, Alex.

              It works realy fine!

              Helmut

              Comment


              • #8
                I have some trouble while using the new efs2 "inv" function.

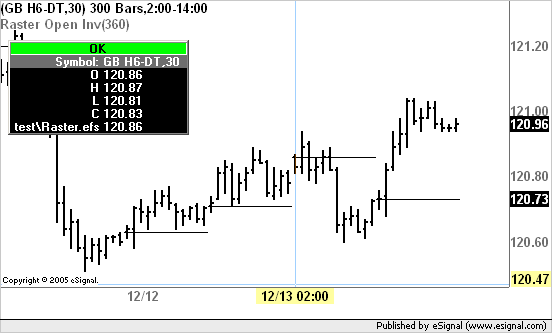
                Please have a look at the code of my efs and the chart shown below.

                The 120.90 line at 8:00 today is not correct. Should be at 120.86, todays opening.

                Has somebody an idea to solve the problem? Thank You!


                function preMain()
                {
                setStudyTitle("Raster Open Inv");
                setDefaultBarFgColor(Color.black,0);
                setDefaultBarThickness(1,0);
                setPlotType(PLOTTYPE_FLATLINES,0);
                setPriceStudy(true);
                setShowCursorLabel(false)

                var fp1 = new FunctionParameter("Intervall", FunctionParameter.NUMBER);
                fp1.setName("Intervall");
                fp1.setDefault(60);

                }

                function main(Intervall)
                {

                var OpenInv = open(0,inv(Intervall));


                return OpenInv;

                }
                Attached Files

                Comment


                • #9
                  Using another parameter for inv() it works fine.
                  Attached Files

                  Comment


                  • #10
                    Helmut
                    The problems you may be seeing with that interval are not caused by the inv() function but because that market begins trading at 08:00 CET equivalent to 23:00 PST hence any bar with an interval greater than 60 minutes will cross the PST midnight and will be reset. As far as I know there currently is no workaround for this issue which should be resolved once the new data servers go into effect (eSignal has provided no date as to when this will happen). Having said that your efs appears to return the correct Open value at my end (see image)
                    Alex

                    Comment


                    • #11
                      Unfortunately at my end this problem keeps having no solution.

                      The conclusion is, european clients wathing the Bund-Future ar not able to use this function with an interval greater 60 min?

                      Is there any CET time during the day you would expect european clients to see the correct figures?
                      Attached Files

                      Comment

                      Working...
                      X