Announcement

Collapse
No announcement yet.

How do I program an indicator to show the gradient of an indicator

Collapse
X
 
  • Filter
  • Time
  • Show
Clear All
new posts

  • How do I program an indicator to show the gradient of an indicator

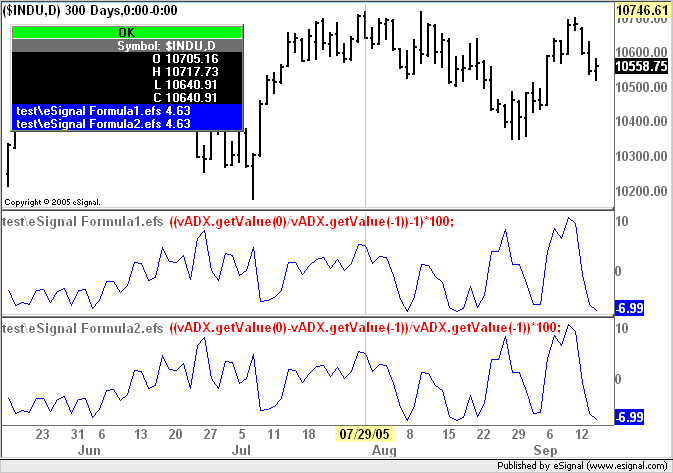
    It's been a long since those Mathematics classes, and almost as long since the programming classes. So if anyone can give me some pointers on how to calculate the 1st derivative of an indicator line (basically I just want a way to judge when an ADX study is increasing, so I don't get stuck with a trade being triggered when the trend is over) I'd be most grateful.

    I can probably program the rest if I can get some pointers towards how to calculate it

  • #2
    Kuro-Bishounen
    One way to do that would be as shown in the example below. This will return the percent increase/decrease of the ADX over 1 period and if the value is positive the ADX is rising.
    Alex

    PHP Code:
    var vADX null;

    function 
    main() {

        if(
    vADX==nullvADX adx(14,14);
        
        if(
    vADX.getValue(-1)==null
        return;
        
        var 
    vSlope = ((vADX.getValue(0)/vADX.getValue(-1))-1)*100;
        
        return 
    vSlope;

    Comment


    • #3
      how about


      var vSlope = ((vADX.getValue(0)-vADX.getValue(-1))/vADX.getValue(-1)))*100;

      Comment


      • #4
        pmurraymc
        That will return the same values
        Alex

        Comment


        • #5
          Thanks,

          I was looking out for your reply - so I could use any solution you suggested.

          I must have made a mistake somewhere - I could not get yours to work - so I re-arranged it, very useful though.

          I have just added it to the frama.efs from Trader's tips.

          Paul.

          Comment


          • #6
            Paul
            You can use either notation. Also if the study you are using is a series you could also use a 1 period roc() which will return the same results.
            Alex

            PHP Code:
            var vADX null;

            function 
            main() {

                if(
            vADX==nullvADX roc(1,adx(14,14));
                
                return 
            vADX.getValue(0);

            Comment


            • #7
              Thanks very much for the help

              Comment


              • #8
                Kuro,

                Here are a few other ideas [which I use]:

                1. If you just want the "direction", you can use either a fast rsi or roc or mom on your study [I use rsi(3, study)].
                Note: Be careful, ADX is a slow reacting indicator, so your info may come late.

                2. If you want the actual slope of the move, this is more tricky, because there is no direct correlation between x and y axis. No matter what method you use, the angle will not be a "usable" info.
                I calculate an AverageBar for the entire data set and use that as x axis, which gives me the most accurate slope [and still get slopes over 90, which is impossible].

                Good Luck!
                Mihai
                Mihai Buta

                Comment


                • #9
                  Mihai
                  FWIW slope expressed as a percentage can be a value greater than 90. In fact 100% slope is equivalent to a 45° angle.
                  Alex


                  Originally posted by mbuta
                  Kuro,

                  Here are a few other ideas [which I use]:

                  1. If you just want the "direction", you can use either a fast rsi or roc or mom on your study [I use rsi(3, study)].
                  Note: Be careful, ADX is a slow reacting indicator, so your info may come late.

                  2. If you want the actual slope of the move, this is more tricky, because there is no direct correlation between x and y axis. No matter what method you use, the angle will not be a "usable" info.
                  I calculate an AverageBar for the entire data set and use that as x axis, which gives me the most accurate slope [and still get slopes over 90, which is impossible].

                  Good Luck!
                  Mihai

                  Comment


                  • #10
                    Originally posted by Alexis C. Montenegro

                    FWIW slope expressed as a percentage can be a value greater than 90. In fact 100% slope is equivalent to a 45° angle.
                    Alex
                    Hi Alexis,


                    I've been trying unsuccessfully to figure out a technique to determine the angle of an EMA or any indicator and ran across your post.

                    I modified the sample code you provided (thank you) and was wondering if the descrption here applies to the sample code you provided?
                    PHP Code:

                    var vEMA null;

                    function 
                    main() {

                        if(
                    vEMA==nullvEMA ema(20);
                        
                        if(
                    vEMA.getValue(-1)==null
                        return;
                        
                        var 
                    vSlope = ((vEMA.getValue(0)/vEMA.getValue(-1))-1)*100;
                        
                        return 
                    vSlope;


                    If so this may be an obvious question but how do the values returned correlate to a 45 degree or a -45 degree (or perhaps it's a 315 degree angle?

                    Thank you very much for your assistance,

                    Glen

                    ps.

                    I also ran across another example below (thanks Steve) which may also do the job, but again too many years have elapsed since my mathematic days and not sure how to correlate the returned values to EMA angle.

                    PHP Code:
                    /* Notes:
                    Study requires version 8.0 or later.
                    Relative Slope efs coded by  -  S. Hare - 1 30 2007, Version 1.0
                    [url]http://share.esignal.com/fileupload.jsp?groupid=339&folder=Slope%20Calculation[/url]
                    Post: [url]http://forum.esignalcentral.com/showthread.php?s=&postid=96877#post96877[/url]

                    Authored by Dimitris Tsokakis, the relative slope takes an exponential moving average of typical 
                    price (HLC/3), commonly a 20 period EMA but the period is customizable. It then takes the resulting 
                    values, and for each value, the previous value is subtracted and the result is divided by the sum 
                    of the two values. These results are then further smoothod with a 3 period EMA.

                    other efs by the same author : [url]http://share.esignal.com/groupcontents.jsp?folder=Charts&groupid=84[/url]  */

                    var bInit false// these are global variables, they can be seen in every part of the efs
                    var flag1 false;
                    var 
                    relativeSlopeSeries null;
                    var 
                    relativeSlope null;
                    var 
                    null;
                    var 
                    fpArray = new Array();

                    function 
                    preMain() {
                        
                    setPriceStudy(false);
                        
                    setShowTitleParameters(false);
                        
                    setStudyTitle("Relative Slope");
                        
                    setCursorLabelName("Relative Slope",0);
                        
                    setDefaultBarFgColor(Color.blue,0);
                        
                    setDefaultBarThickness(2,0);
                        
                    addBand0PS_SOLID1Color.red);
                        
                    InitFunctionParameter();
                    }

                    function 
                    main(Smoothing,P) {
                        if(
                    bInit == false){
                            
                    relativeSlopeSeries ema(SmoothingefsInternal("RelativeSlope"Phlc3));
                            
                    bInit true;
                        }
                        
                        if (
                    getBarState() == BARSTATE_NEWBAR)    {}
                        
                        
                    relativeSlope relativeSlopeSeries.getValue(0);
                        if(
                    relativeSlope>0)
                        {
                            
                    setDefaultBarFgColor(Color.green,0);
                        }
                        else
                        {
                            
                    setDefaultBarFgColor(Color.red,0);
                        }
                        return 
                    relativeSlope;
                    }
                        
                    function 
                    RelativeSlope(len,source)
                    {
                        if(
                    bInit == false){
                            
                    ema(lensource());
                            
                    bInit true// this starts out as a global value set to false, but is distinct from other instance in main
                        
                    }
                        
                        if(!
                    flag1)
                        {
                            
                    flag1 = (X.getValue(-1)!=null);
                            return 
                    null;
                        }
                        
                        var 
                    testForZero X.getValue(0)+X.getValue(-1);
                        if(
                    testForZero == 0)
                        {
                            
                    testForZero +=.001;
                        }
                        
                        var 
                    2*(X.getValue(0)-X.getValue(-1))/testForZero;
                        return (
                    Y*100);
                    }

                    // now the customizable user inputs 
                    function InitFunctionParameter()
                    {
                        var 
                    0;
                        
                    fpArray[x] = new FunctionParameter("Smoothing"FunctionParameter.NUMBER);
                        
                    with(fpArray[x++])
                        {
                            
                    setName("Smoothing");
                            
                    setLowerLimit(1);
                            
                    setDefault(3);
                        }
                        
                    fpArray[x] = new FunctionParameter("P"FunctionParameter.NUMBER);
                        
                    with(fpArray[x++])
                        {
                            
                    setName("User Supplied Period");
                            
                    setLowerLimit(5);
                            
                    setDefault(20);
                        }

                    Glen Demarco
                    [email protected]

                    Comment


                    • #11
                      As I got copied on this message, so I want to re-iterate what I said years ago:
                      No "slope" has meaning, unless the x and y axis have THE SAME UNIT OF MEASURE.

                      Only if that is achieved, a rise of 1 over a period of 1 means 45%.
                      I already described my way of achieving that desiderata expressing the slope in AverageBars].

                      But even this [have the correct angle/slope] there is little meaning to get from it, because a 45% angle on MA3 means less [in term of momentum of a wave/cycle] than a 15% of a MA100.

                      There many other ways to measure the momentum [which is what we all are looking for], much simpler and much more meaningfull than the slope.

                      Mihai buta
                      Mihai Buta

                      Comment


                      • #12
                        Mihai,

                        Thanks for the response, I appreciate your suggestions.

                        It sounds like you have better solutions for measuring the strength of a trend.

                        At this time I do not. I'm trying to simply determine the angle of 20 period EMA and wanted to know if the code posted provided that information and if so how to correlate the values returned with the angle.

                        I have tried the roc(1,study) and mom(1,study) and will try the rsi(3,study).

                        My background is in trading and technical analysis. I'm not a developer and my math background is minimal. The answer may be in the code and information posted I just am not getting it.

                        Thanks for your help.

                        Glen
                        Glen Demarco
                        [email protected]

                        Comment


                        • #13
                          Glen,

                          Forget slopes.
                          Use rsi(3,sma20).
                          Because this is slow, use rsi(3,sma10) and rsi(3,sma5) to "anticipate" the next cycle.

                          I have normalized rsi, to +1/-1 [when above 80, or below 20]so, MyRSI>1 means TrendUp and MyRSI<-1 means TrendDn.

                          You know I am not a programmer either.
                          Good Luck!

                          Mihai
                          Last edited by mbuta; 10-02-2008, 12:06 PM.
                          Mihai Buta

                          Comment


                          • #14
                            Mihai,

                            Thanks very much for your response, I appreciate your help.

                            I'm including 2 efs's, one to plot the values returned from the rsi(x,SMX) functions and one to indicate when the returned values are greater then 80 and less then 20, indicating a up or down trend.

                            Is this how you would make a trend determination, ie., am I interpeting your post correctly?

                            This looks like a very interesting solution, one I would have never thought of. I'll incorporate it into a simple strategy based on off of a moving average and see if it can filter out some of those unwanted sideways movement signals.

                            Any suggestions on using the ADX?

                            I find it a very useful indicator once in a trade, as when ADX is increasing, the trend usually continues as long as ADX is rising.

                            I've not had much success with +DI -DI crossover systems, nor with only taking trades when the ADX is above a certain value, ie., 30.

                            BTW I've seen your code and I'd trade your programming skills for mine anyday.

                            Thanks again I appreciate the help.

                            Glen

                            PHP Code:
                            /* Non price study to plot rsi of two sma's. 
                             */
                            var vSMA10 null;
                            var 
                            vSMA5 null;

                             function 
                            preMain(){
                              
                            //  setPriceStudy(true);
                                
                            setDefaultBarFgColor(Color.blue0);
                                
                            setDefaultBarFgColor(Color.magenta1);
                            }
                            function 
                            main() {

                                if(
                            vSMA10 ==nullvSMA10 sma(10);
                                if(
                            vSMA5 ==nullvSMA5 sma(5);
                                if(
                            vSMA10.getValue(-1)==null
                                if(
                            vSMA5.getValue(-1)==null
                                return;
                                
                                var   
                            vSlope1 rsi(3,vSMA5);
                                var   
                            vSlope2 rsi(3,vSMA10);
                                
                                
                                return Array(
                            vSlope1vSlope2);
                            }

                            /* Price study to draw up or down triangles indicating an up or down trend */
                            var vSMA10 null;
                            var 
                            vSMA5 null;

                             function 
                            preMain(){
                                
                            setPriceStudy(true);
                                
                            setDefaultBarFgColor(Color.blue0);
                                
                            setDefaultBarFgColor(Color.magenta1);
                            }
                            function 
                            main() {

                                if(
                            vSMA10 ==nullvSMA10 sma(10);
                                if(
                            vSMA5 ==nullvSMA5 sma(5);
                                if(
                            vSMA10.getValue(-1)==null
                                if(
                            vSMA5.getValue(-1)==null
                                return;


                                var   
                            vSlope1 rsi(3,vSMA5);
                                var   
                            vSlope2 rsi(3,vSMA10);
                                
                                if (
                            vSlope1 80 )   drawShape(Shape.UPTRIANGLEBelowBar3Color.RGB(0,123,0));
                                if (
                            vSlope2 80 )   drawShape(Shape.UPTRIANGLEBelowBar4Color.RGB(0,255,0));
                               
                                if (
                            vSlope1 20 )   drawShape(Shape.DOWNTRIANGLEAboveBar3Color.RGB(123,0,0));
                                if (
                            vSlope2 20 )   drawShape(Shape.DOWNTRIANGLEAboveBar4Color.RGB(255,0,0));


                                return; 

                            Attached Files
                            Last edited by demarcog; 10-02-2008, 05:06 PM.
                            Glen Demarco
                            [email protected]

                            Comment


                            • #15
                              Glen,

                              Yes, that is how I use rsi(MA), like you said, but ONLY WHEN APPROPRIATE, that is AFTER the cycle started.
                              If eliminating the "side moves" is what you want to filter out, then ADX can help you, but I use 20 as "Trend Level", not 30.
                              Regarding DI+/DI-: (DI+)-(DI-)=RSI [or very close to it], so I use RSI instead.

                              Keep in mind that those "side moves" you refer to, are nothing but Wave 4's at higher time interval [most of time], so you must look at them, in order to determine to stay in or get out.

                              As a general rule, you must chose the interval you trade at, such that you should get out during W4 [at 20 period] and decide later if you want to get back in for W5's.

                              The problem is that same W4 may actually be W2 of a higher time interval, so you that should be your main [or first] entry in a cycle.
                              That is why chosing the right interval is extremelly important.

                              You can take a look at my Multi Time Intervals shared files and see how many indicators look like.
                              Remember, there is indicator that "fits all sizes/situations", so you must look at each one of them with their meaning and interpretation, at the proper time of a cycle.
                              Also, keep in mind that no one time interval in "the interval" and no time interval is independent. You know my theory: Every major move starts with one tick at the lowest time interval possible and propagates all the way up to daily/weekly/etc. I can always point to that particular bar [say on 1min chart] that started the cycle at 60min or higher, always.

                              Good Luck
                              Mihai Buta

                              Comment

                              Working...
                              X