Announcement

Collapse
No announcement yet.

Need an efs for showing Absolute Difference of Moving Average over time

Collapse
X
 
  • Filter
  • Time
  • Show
Clear All
new posts

  • Need an efs for showing Absolute Difference of Moving Average over time

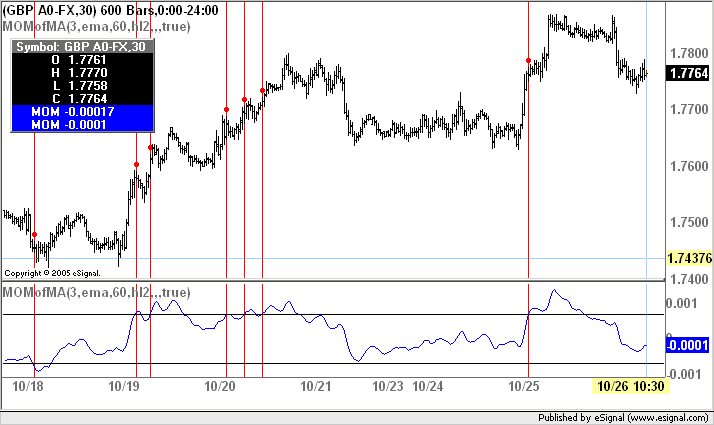
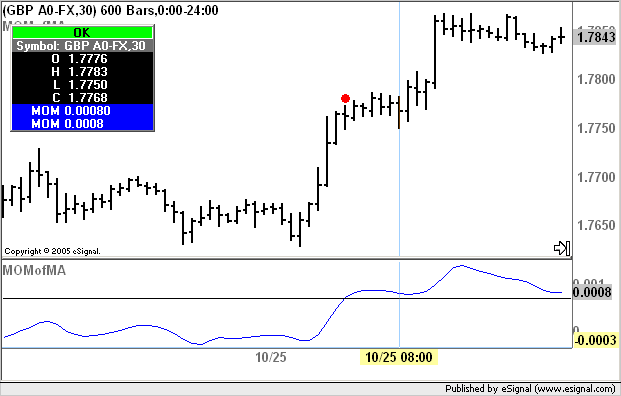
    Hi - I'm looking for an EFS formula that can give me a dot or visible alert whenever a moving average changes its value by a set amount over a set number of bars. I don't want to see this as a line or a histogram, etc. but as a simple visual cue that shows me when my set threshold has been exceeded.

    So the parameters I would like to control as variables include which MA I want (simple, exp., weighted); source (open, close, HL/2), time period for the MA, and then parameters for how many bars are in the difference calculation, and what the threshold would be before an alert would be issued.

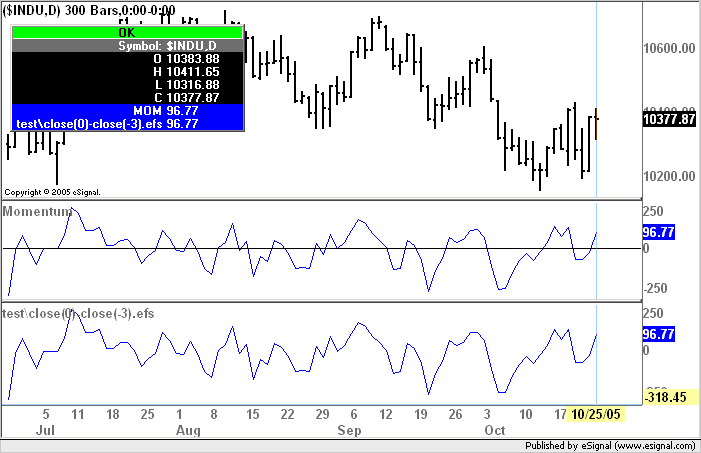
    The difference calculation is just a simple subtraction: how many ticks different is the moving average right now from what it was x bars ago.

    For instance, if I set my theshold to 7 and my number of bars to 4 - if my moving average is going along and the difference of its value now is only 3 ticks off from what is was 4 bars ago - no alert; if the difference from what it is in the current bar to what it was 4 bars ago is now 8 - a dot or alert is generated on screen.

    I'd REALLY appreciate help from anyone willing to program this formula for me, and would gladly pay for the help too!
    I do know some Javascript, but have never before programmed efs, but might be able to put it together if that's the only way to go... but at this point would love to be able to just pop an efs in and roll with it.

    Many many thanks!
    Mindy

  • #2
    Mindy
    If I understood you correctly what you need is a study that calculates the momentum of a moving average. Click here and download MOMofMA.efs. In this study all the parameters for both the Momentum and Moving Average studies are user definable.
    To add an alert to the script you would need to do the following
    Create a global variable (ie outside of function main) called bAlert and set it to false

    PHP Code:
    var bAlert false
    Then in function main just above the return statement add the following section of code

    PHP Code:
    var Threshold 5//set this value to one of your choice
        
    if(bAlert==false){//if the bAlert flag is false
        
    if(xMOMofMA.getValue(0) >= Threshold || xMOMofMA.getValue(0) <= -Threshold){//if one of these conditions is true
            
    Alert.addToList(getSymbol(),"Threshold exceeded",Color.black,Color.red);//trigger the alert
            
    bAlert true;//set the bAlert flag to true (this will allow only one alert until a reset occurs)
        
    }
    }
    if(
    getBarState()==BARSTATE_NEWBAR && bAlert==true){//at every new bar if the bAlert flag is true
        
    if(xMOMofMA.getValue(0) < Threshold && xMOMofMA.getValue(0) > -Threshold){//if this condition is true
            
    bAlert false;//reset the bAlert flag to false
        
    }

    If you do not wish to plot the indicator then replace return getSeries(xMOMofMA); with return;
    and in preMain change setPriceStudy(false) to setPriceStudy(true)
    Alex

    Comment


    • #3
      Dear Alex, Thank you SO much for your good thinking and your time on this. And what an amazing library you have created - thanks for sharing it.

      A few questions: is what you refer to as the length of momentum the same as I was looking for as the paramter to set for how many candles the difference is measured over i.e. if I am looking for a 5 pip change over 4 candles, and I simply setting the momentum length to 4?

      Is there a way I can incorporate the threshold as a parameter in the edit studies dialog box, rather than going back in to the script to change it out each time I want to look at different values?

      Can I have it put a dot or symbol on the charts whereever it sees a value exceeding the threshold I have set, rather than use the text alert system?

      Thanks again so much for your help!!!

      Mindy

      Comment


      • #4
        Mindy
        You are most welcome.
        Here are the answers to some of your questions

        is what you refer to as the length of momentum the same as I was looking for as the paramter to set for how many candles the difference is measured over ...?

        Yes it is the same.

        Can I have it put a dot or symbol on the charts whereever it sees a value exceeding the threshold I have set, rather than use the text alert system?

        Yes you can. Having said that if you want the dot to appear in the price window you will need to make sure that in preMain you have setPriceStudy(true) and that you are not returning the study to the chart (see the instructions I provided in my prior reply). To draw a dot replace
        Alert.addToList(getSymbol(),"Threshold exceeded",Color.black,Color.red);
        with
        drawShape(Shape.CIRCLE,AboveBar1,Color.red);
        A red dot will be drawn above the bar every time either condition is true.
        Alex

        Comment


        • #5
          Mindy
          Following up on my prior message..

          Is there a way I can incorporate the threshold as a parameter in the edit studies dialog box, rather than going back in to the script to change it out each time I want to look at different values?

          Yes it is possible. If you want to try to add that yourself you can find an example of how to do it in this thread otherwise I can guide you through the process.
          Alex

          Comment


          • #6
            Dear Alex,
            Fantastic! And thanks again so much for your patient and thorough help!

            I think I am 93% of the way there. I now have beautiful red dots showing up above my candles just like I wanted, and a user-definable threshold setting in the edit studies dialog box.

            My only problem now is... the data that it produces is not what I am expecting....!?!
            Or rather I should say, sometimes it is, but sometimes it is not. I also have the MOMofMA study up (your original one, thank you) to compare what it thinks the values should be, so I get a numeric readout too.

            I am comparing it to doing the math manually, by taking the values of my chosen MA that I see in the floating cursor window dialog for one candle, and comparing them to those values on a candle x bars away (ie - the value set in the MOM Length) - and sometimes they correlate and sometimes they just don't at all.

            For instance here's an example with readings for the 60 EMA (hl2) on the GBP yesterday morning (my MOM length is set to 3 and my threshold set to 0.007):

            I have:
            candle 1 at 1.76720, and
            candle 4 at 1.76791

            and the MOMofMA gives me 0.0007 and I get a red dot and am happy.

            But then I look at
            candle 7 at 1.76878, and
            candle 10 at 1.76958

            and the MOMofMA gives me a reading of 0.0007, but a simple subtraction gives me 0.0008.

            And as I run through numerous other comparisons to hand-check the values, I see similar points of confluence and divergence from what I expect.

            I'm wondering if this is a by-product of the momentum function - that it does some smoothing or interpolation or rounding.

            Which brings me back to my original quest: could you help me devise a formula that just does a subtraction of the value of a MA at one point in time from its value x candles before?

            Also wondering if there is a way to force 4 digit accuracy for all figures - or maybe that's just a by-product of the momentum function too. I've noticed it with MACD readouts on eSignal too. When values are less than 0.001 you get 4 digit accuracy, but anything between 0.001 and 0.002 reads out as 0.001 (instead of, say 0.0013)...?

            Thank you in advance for any help you can offer, or illumination of this curious behavior,

            Your new biggest fan,

            Mindy

            Comment


            • #7
              Mindy
              Before proceeding any further you may want to tell me what interval you are using and how the Time Template is set up so that I can verify at my end what you are seeing.

              Which brings me back to my original quest: could you help me devise a formula that just does a subtraction of the value of a MA at one point in time from its value x candles before?

              That is what I have been doing so far. FYI all the Momentum study does is measure the difference between the current value and the value at x bars ago (where x is the length of the Momentum).
              So if you were to run a 3 period Momentum of the Close it would be the same as writing a script that calculates close(0)-close(-3)
              The image below shows a comparison between a 3 period Momentum (using the customMomentum.efs which is in the EFS2 Custom folder) and the enclosed script. As you can see the results are identical
              Alex

              PHP Code:
              function main(){

              return 
              close(0)-close(-3);

              Comment


              • #8
                Good Morning Alex - you don't sleep much either, huh?!

                Wow - I see what you're saying about the equality of the momentum and the subtraction function.... hmmm...

                I'm sorry, but I'm not quite sure which values you are asking for - interval of what? Time Template of what - or where do I access that setting to be able to tell you?

                I'm looking right now at 30 minute candles on the GBP - is that what you meant?

                Is this getting too specific for the general bulletin board - shall I contact you directly some how? (and are you available for private consultations?)

                Thanks again, Mindy

                Comment


                • #9
                  Mindy

                  I'm looking right now at 30 minute candles on the GBP - is that what you meant?

                  Yes that is what I meant with interval.
                  As to what a Time Template is you may want to read this artticle in the eSignal KnowledgeBase
                  With regards to the thread being too specific this is exactly what these forums are meant for.
                  I am not available outside of the forum
                  Alex

                  Comment


                  • #10
                    OK -

                    Thanks for your answers - I understand. It's just so wonderful the help you do offer on this forum!

                    I'm not using a specific Time Template, just the automatic default setting for Forex data on eSignal, which is:

                    Forex (bid/ask data only)
                    Daily: 5 + Years
                    Intraday: 120 Days
                    Tick: 10 Days

                    Mindy

                    Comment


                    • #11
                      Mindy
                      Can you please confirm all the settings you are using in your study including the "threshold" value.
                      In a prior message you mentioned that you had the threshold set at 0.007 and as far as I can see that would not trigger any signals since the highest reading I am getting over the last 10 days is 0.0014 and the lowest is less than -0.001
                      Alex

                      Comment


                      • #12
                        OOops - my apology!

                        My threshold is 0.0007
                        (blame it on a sticky keyboard - missed a zero)

                        I got a nice red dot alert on the candle at 10/25 at 2:00 PDT. Here are the dates and times for the candles I was mentioning before when I got varying values:

                        candle 1 (at 10/25 00:30) at 1.76720, and
                        candle 4 (at 10/25 02:00) at 1.76791

                        and the MOMofMA gives me 0.0007 and I get a red dot and am happy.

                        But then I look at
                        candle 7 (at 10/25 03:30) at 1.76878, and
                        candle 10 (at 10/25 05:00) at 1.76958

                        Would more "discrepant" examples help?

                        Comment


                        • #13
                          Mindy
                          I ran the script with all the changes I have suggested in the course of this thread and with the following settings:
                          30 min chart of GBP A0-FX
                          Momentum length 3
                          Exponential Moving Average of hl2 length 60
                          Threshold 0.0007
                          On the same chart I also ran the MOMofMA.efs showing bands at 0.0007 and -0.0007.
                          The resulting signals can be seen in the following image.


                          The last red dot appears on 10/25/2005 at 0500 EDT which confirms your findings.
                          The values of the indicator at the date/times you mention are at or above 0.0007 however no dots will be shown because the indicator never went below 0.0007 to reset the flag (see the indicator pane in the chart). The dots will appear only the first time either 0.0007 or -0.0007 is breached.
                          Alex

                          Comment


                          • #14
                            Yes, thank you Alex - that is what I got too - so I am mostly happy - yet I continue to be disturbed by why the algorithm of the MOMofM tells me that the difference between these two candles

                            10/25 03:30 (PDT) at 1.76878, minus
                            10/25 05:00 (PDT) at 1.76958

                            equals 0.0007 when in fact it equals 0.0008


                            Can you explain that?

                            I am looking for precision in defining an edge, and the differences from candle to candle - as well as where that red dot appears - are important to me, and an "error" like this might throw things off in unexpected ways.

                            Thanks for hanging in there with me on this!

                            Mindy

                            Comment


                            • #15
                              Mindy
                              That is just due to the rounding in the display. The value that is actually calculated is 0.0008 (see image below).
                              Do the following. In the original MOMofMA.efs add the following line of code before the return statement
                              var myValue = getSeries(xMOMofMA).toFixed(5)
                              Then in the return statement replace
                              getSeries(xMOMofMA)
                              with
                              myValue*1
                              The value at the bar you mention should now display as 0.0008 as in the image below (the bar is time stamped 08:00 in my chart because I am on EDT)
                              Alex

                              Comment

                              Working...
                              X