Announcement

Collapse
No announcement yet.

example on use of PLOTTYPE_INSTANTCOLORLINE

Collapse
X
 
  • Filter
  • Time
  • Show
Clear All
new posts

  • example on use of PLOTTYPE_INSTANTCOLORLINE

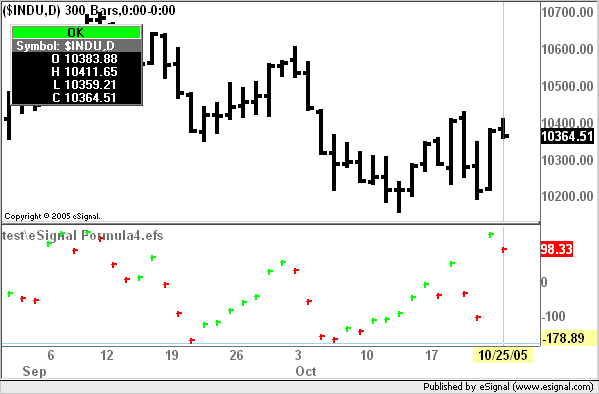
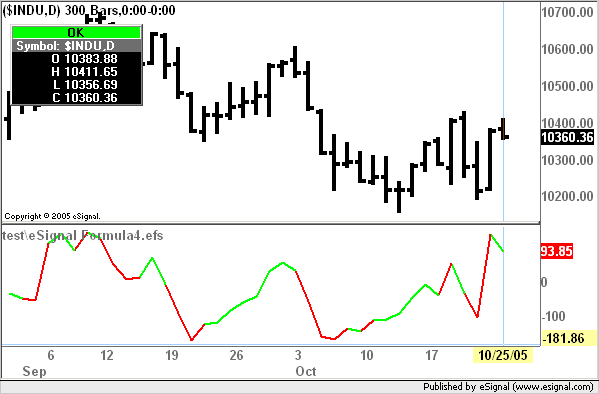
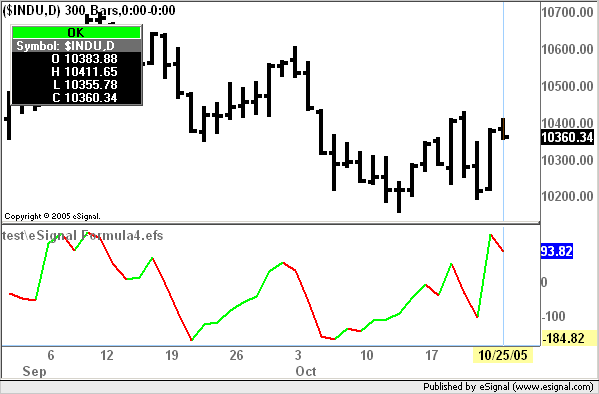
    Are there any threads with examples using PLOTTYPE_INSTANTCOLORLINE? I have done a search and get some indirect references to it, but a couple simple examples would help understand how to apply it I also did not find anything in the help files.

    In particularly, how best to apply the color, and why this is better than just using setBarFgColor to change color.

    Thanks very much. Joe.

  • #2
    Joe
    The PLOTTYPE_INSTANTCOLORLINE statement instructs the efs to color the plot "backwards" rather than "forwards". Here is a practical example using a CCI study and coloring the plot with the following conditions

    PHP Code:
    if(myCCI.getValue(0)>myCCI.getValue(-1))
            
    setBarFgColor(Color.lime)
        else
            
    setBarFgColor(Color.red
    In the first image I am using PLOTTYPE_DOT


    As you can see the colors correspond to the conditions. A higher dot is green and a lower dot is red.
    If I now use any of the continuous line plots (for example PLOTTYPE_LINE) the efs will "join" these dots using the color of prior dot going forward


    The result is that there will be times when the plot is going down and is colored in green or going up and colored in red.
    PLOTTYPE_INSTANTCOLORLINE resolves the issue by reversing the process and coloring the line using the color of the last dot going backwards as shown in the next image
    Alex

    Comment


    • #3
      I implemented PLOTTYPE_INSTANTCOLORLINE in my premain.

      If you look at the examples below you see that in the one without PLOTTYPE_INSTANTCOLORLINE that the value showing in the y-axis is colored to reflect the value in the study whereas the one with PLOTTYPE_INSTANTCOLORLINE has the last study value colored blue.

      How do I get the y-axis value to be colored as the study is colored when using PLOTTYPE_INSTANTCOLORLINE?

      Comment


      • #4
        buhrmaster
        See this post for an explanation as to why the Y-Axis label uses the default color with INSTANTCOLORLINE
        Alex

        Comment


        • #5
          Thanks for the response but I agree with Mihai -- only half done.

          Whatever the "explanation" it makes no practical sense to not reflect the current state of the bar as is done with other plot types -- it kind of takes away the utility of the instantcolorline.

          Comment


          • #6
            buhrmaster
            I have to disagree as I find it very useful and in fact have used it extensively for over two years.
            Regardless the current state of the bar is defined by the data point which is in fact the color you see in the Cursor Window. The Y-Axis label instead reflects the color of the continuous line and that is not defined with INSTANTCOLORLINE until the next data point is colored.
            Alex

            Comment


            • #7
              Alex-

              My first response was change the definition so that INSTANTCOLORLINE becomes more useful . . . .

              However, I reloaded the code and the y-axis then showed accurately, I think, the state of the last bar relative to the previous one by changing the changing the color (no longer always blue!).

              However the color of the y-axis value won't always change when it should -- I have to move the mouse in the window and then it will change -- and then only when the cursor window is showing. Since I never use the cursor window, I'd say this could have been useful, but isn't.

              I'm not sure saying it is half done accurately describes the situation. Sounds like something for the programmers to look at.

              Comment


              • #8
                buhrmaster
                Not sure how you get it to change since with INSTANTCOLORLINE the color of the Y-axis is defined by the default foreground color of the plot.
                You can make it change by always using setDefaultBarFgColor() instead of setBarFgColor(). In that case the default color gets set by the last data point and the Y-axis color changes accordingly
                Alex

                Comment


                • #9
                  Alex-

                  You're right. I realized that after sending the last post.

                  Unfortunately it still doesn't seem to refresh to the default color until there is a mouseover event with the cursor window open (or at least that is what it seems).

                  I give up unless there is a way to force the y-axis value to use the latest default color. It is more important to me to see what the last value is doing than to have the study's colors 100% correct.

                  Comment


                  • #10
                    buhrmaster
                    Try replacing all instances of setBarFgColor(Color.xxx) with setDefaultBarFgColor(Color.xxx) and it should work the way you want it to (unless you use setComputeOnClose or BARSTATE_NEWBAR)
                    Alex

                    Comment


                    • #11
                      Alex-

                      I already was using setDefaultBarFgColor() and the only reference to BARSTATE_NEWBAR is in an if-statement where I need to set a variable to hold the last complete bar's last value.

                      Incidentally, the same code without INSTANTCOLORLINE doesn't have a problem changing colors on Y-axis.

                      Any other ideas?

                      Comment


                      • #12
                        buhrmaster
                        Try the code enclosed below and you should see that the Y-axis label will take on the color of the last data point. That happens because the default color for that plot is set by the conditions at every tick.
                        With all the other continuous plot types the space in between the bars is colored by the prior data point hence the color for the space to the right of the last data point is defined. This is why in those cases the Y-axis labels take on the color of the last data point
                        If your script is not behaving in the same way then you need to post it.
                        Alex

                        PHP Code:
                        function preMain() {
                            
                        setPriceStudy(true);
                            
                        setStudyTitle("SMA");
                            
                        setCursorLabelName("SMA",0);
                            
                        setDefaultBarFgColor(Color.black,0);
                            
                        setPlotType(PLOTTYPE_INSTANTCOLORLINE,0);
                            
                        setDefaultBarThickness(2,0)
                        }

                        var 
                        vMA null;

                        function 
                        main() {
                            if(
                        vMA==nullvMA sma(5);
                            
                            if(
                        vMA.getValue(0)>vMA.getValue(-1))
                                
                        setDefaultBarFgColor(Color.lime);
                            else if(
                        vMA.getValue(0)<vMA.getValue(-1))
                                
                        setDefaultBarFgColor(Color.red);
                            else 
                        setDefaultBarFgColor(Color.blue);

                            return 
                        vMA.getValue(0);

                        Comment

                        Working...
                        X