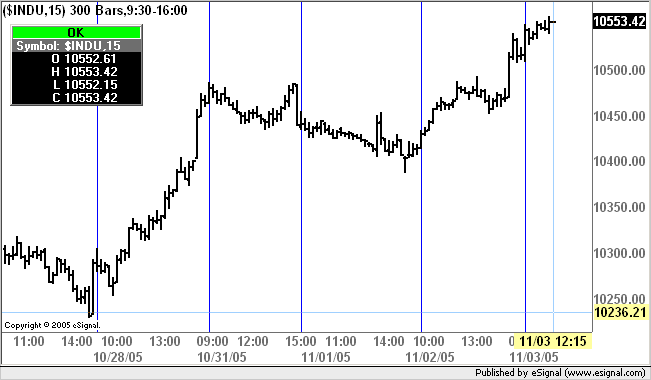
I would like a study that would plot the first hour high and low as vertical lines on the chart, RTH only. Thanks for any help.
Announcement
Collapse
No announcement yet.
first hour high and low
Collapse
X
-
scolberg13
One way to do it is the following (the example is for drawing a vertical line on the bar with the highest High in the first hour)
Create a global variable (ie outside of function main) called for example vHigh and set it initially to 0
Then in main you first set the value of vHigh to the High at 9:30PHP Code:var vHigh = 0;
Then in between the hours of 9:30 and 10:30 you check if the current High is higher than vHigh and draw a vertical line on the bar with the highest HighPHP Code:if((getHour(0)*100)+getMinute(0)==930){
vHigh=high(0)
}
Note that in order to draw only one line per day I use getDay(0) as the counter for the TagName parameter.PHP Code:if((getHour(0)*100)+getMinute(0)>=930&&(getHour(0)*100)+getMinute(0)<=1030){
if(high(0)>=vHigh){
vHigh = high(0);
drawLineRelative(0, 0, 0, Infinity*1, PS_SOLID,1, Color.blue, "high"+getDay(0));
}
}
Add the logic for the Low and you should see the two vertical lines on the bars with the highest/lowest High/Low in between 9:30 and 10:30
Alex

Originally posted by scolberg13
I would like a study that would plot the first hour high and low as vertical lines on the chart, RTH only. Thanks for any help.
Comment