Announcement

Collapse
No announcement yet.

Pivot Points Question

Collapse
X
 
  • Filter
  • Time
  • Show
Clear All
new posts

  • #16
    James
    You can find an example of how to do it in this thread
    Alex


    Originally posted by James 88
    Hi

    Is it possible to ONLY display the current day's pivots. Could I edit the efs to achieve this?

    Rgds, James
    Comment


    • #17
      Alexis, thank you, James

      PHP Code:
      function preMain() {
          
      setPriceStudy(true);
          
      setStudyTitle("Pivot Points");
          
      setCursorLabelName("PP-R2"0);
          
      setCursorLabelName("PP-R1"1);
          
      setCursorLabelName("PP"2);
          
      setCursorLabelName("PP-S1"3);
          
      setCursorLabelName("PP-S2"4);
          
      // R2
          
      setDefaultBarStyle(PS_DASH0);
          
      setDefaultBarFgColor(Color.RGB(255,0,0), 0);
          
      setDefaultBarThickness(20);
          
      // R1
          
      setDefaultBarStyle(PS_DOT1);
          
      setDefaultBarFgColor(Color.RGB(0,0,255), 1);
          
      setDefaultBarThickness(11);   
          
      // Pivot  Point
          
      setDefaultBarStyle(PS_SOLID2);
          
      setDefaultBarFgColor(Color.RGB(0,0,0), 2);
          
      setDefaultBarThickness(12);
          
      // S1
          
      setDefaultBarStyle(PS_DOT3);
          
      setDefaultBarFgColor(Color.RGB(0,0,255), 3);
          
      setDefaultBarThickness(13);
          
      // S2
          
      setDefaultBarStyle(PS_DASH4);
          
      setDefaultBarFgColor(Color.RGB(255,0,0), 4);
          
      setDefaultBarThickness(24);
      }

      var 
      bInit false;
      var 
      xHigh  null;
      var 
      xLow   null;
      var 
      xClose null
      var 
      vPP null;
      var 
      vR1 null;
      var 
      vS1 null;
      var 
      vR2 null;
      var 
      vS2 null;  
      var 
      bCurrentDay false;


      function 
      main() {

          if(
      getBarState()==BARSTATE_ALLBARS){
              
      bCurrentDay=false;
          }
          if (
      bCurrentDay == false && getDay(0) != getDay(-1)){ 
              var 
      xTime getValue("time");
              var 
      xDate = new Date(); 
              var 
      sTime = (xTime.getMonth()+1+"/"+xTime.getDate()+"/"+xTime.getFullYear()); 
              var 
      sToday = (xDate.getMonth()+1+"/"+xDate.getDate()+"/"+xDate.getFullYear()); 
              if ( 
      sTime == sToday ) { 
                  
      bCurrentDay true
              } 
          } 
          if (
      bCurrentDay==false){
              return;
          }
          if(
      isMonthly() || isWeekly())
          return;
          
          if(
      bInit == false){
              
      xHigh  high(inv("D"));
              
      xLow   low(inv("D"));
              
      xClose close(inv("D")); 
              
      bInit true;
          }
          
          var 
      vHigh  xHigh.getValue(-1);
          var 
      vLow   xLow.getValue(-1);
          var 
      vClose xClose.getValue(-1); 
          if(
      vHigh == null || vLow == null || vClose == null)
          return;
          
          
      vPP = (vHigh+vLow+vClose)/3;
          
      vR1 2*vPP-vLow;
          
      vS1 2*vPP-vHigh;
          
      vR2 = (vPP-vS1)+vR1;
          
      vS2 vPP-(vR1-vS1);  
          
          return new Array(
      vR2vR1vPPvS1vS2);

      Comment


      • #18
        James
        You are most welcome
        Alex


        Originally posted by James 88
        Alexis, thank you, James

        PHP Code:
        function preMain() {
            
        setPriceStudy(true);
            
        setStudyTitle("Pivot Points");
            
        setCursorLabelName("PP-R2"0);
            
        setCursorLabelName("PP-R1"1);
            
        setCursorLabelName("PP"2);
            
        setCursorLabelName("PP-S1"3);
            
        setCursorLabelName("PP-S2"4);
            
        // R2
            
        setDefaultBarStyle(PS_DASH0);
            
        setDefaultBarFgColor(Color.RGB(255,0,0), 0);
            
        setDefaultBarThickness(20);
            
        // R1
            
        setDefaultBarStyle(PS_DOT1);
            
        setDefaultBarFgColor(Color.RGB(0,0,255), 1);
            
        setDefaultBarThickness(11);   
            
        // Pivot  Point
            
        setDefaultBarStyle(PS_SOLID2);
            
        setDefaultBarFgColor(Color.RGB(0,0,0), 2);
            
        setDefaultBarThickness(12);
            
        // S1
            
        setDefaultBarStyle(PS_DOT3);
            
        setDefaultBarFgColor(Color.RGB(0,0,255), 3);
            
        setDefaultBarThickness(13);
            
        // S2
            
        setDefaultBarStyle(PS_DASH4);
            
        setDefaultBarFgColor(Color.RGB(255,0,0), 4);
            
        setDefaultBarThickness(24);
        }

        var 
        bInit false;
        var 
        xHigh  null;
        var 
        xLow   null;
        var 
        xClose null
        var 
        vPP null;
        var 
        vR1 null;
        var 
        vS1 null;
        var 
        vR2 null;
        var 
        vS2 null;  
        var 
        bCurrentDay false;


        function 
        main() {

            if(
        getBarState()==BARSTATE_ALLBARS){
                
        bCurrentDay=false;
            }
            if (
        bCurrentDay == false && getDay(0) != getDay(-1)){ 
                var 
        xTime getValue("time");
                var 
        xDate = new Date(); 
                var 
        sTime = (xTime.getMonth()+1+"/"+xTime.getDate()+"/"+xTime.getFullYear()); 
                var 
        sToday = (xDate.getMonth()+1+"/"+xDate.getDate()+"/"+xDate.getFullYear()); 
                if ( 
        sTime == sToday ) { 
                    
        bCurrentDay true
                } 
            } 
            if (
        bCurrentDay==false){
                return;
            }
            if(
        isMonthly() || isWeekly())
            return;
            
            if(
        bInit == false){
                
        xHigh  high(inv("D"));
                
        xLow   low(inv("D"));
                
        xClose close(inv("D")); 
                
        bInit true;
            }
            
            var 
        vHigh  xHigh.getValue(-1);
            var 
        vLow   xLow.getValue(-1);
            var 
        vClose xClose.getValue(-1); 
            if(
        vHigh == null || vLow == null || vClose == null)
            return;
            
            
        vPP = (vHigh+vLow+vClose)/3;
            
        vR1 2*vPP-vLow;
            
        vS1 2*vPP-vHigh;
            
        vR2 = (vPP-vS1)+vR1;
            
        vS2 vPP-(vR1-vS1);  
            
            return new Array(
        vR2vR1vPPvS1vS2);

        Comment


        • #19
          Hello... I saw this discusion.. Alex.. do you have the efs for calculating the prior candles daily or weekly floor trader pivot point? The ones I have have the wrong calculations... I am looking for H+L+C/3

          I cant seem to find the correct one and I have no idea how to do it myself nor want too....

          thanks
          bob

          Comment


          • #20
            bob
            As far as I can see the daily and weekly pivot studies that are installed with eSignal in the Pivots folder are calculating and plotting correctly.
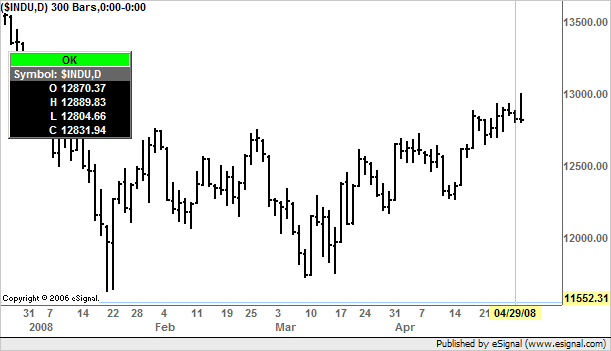
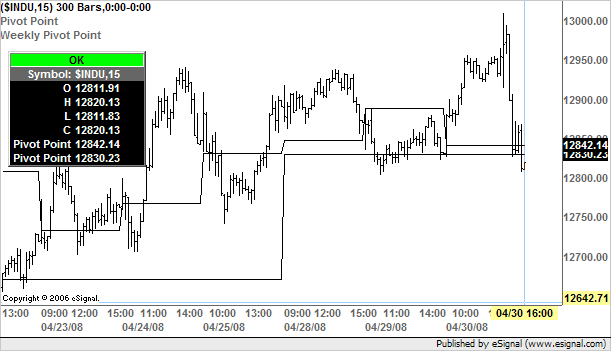
            As an example see the following screenshots of a 30 minute chart of $INDU in which I am plotting the PivotPoint.efs and w_PivotPoint.efs


            The value for the daily pivot point is 12842.14 and that of the weekly is 12830.23
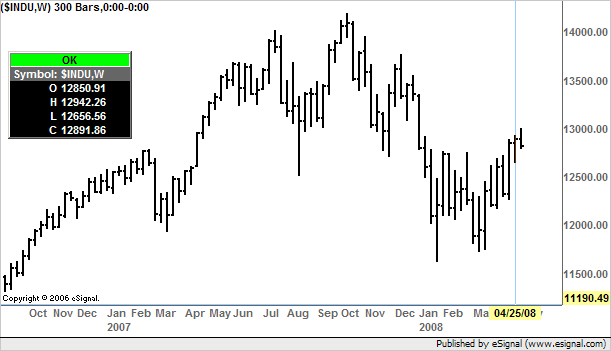
            These are based on the prior day's and week's bars the charts of which are enclosed below (note that in each chart the cursor is located on the prior day's and week's bar and the values can be seen in the Cursor Window).


            Following are the High, Low and Close values from the prior day and week and the calculated pivot point(s)
            12889.83 (H) + 12804.66 (L) + 12831.94 (C) = 38526.43 / 3 = 12842.14
            12942.26 (H) + 12656.56 (L) + 12891.86 (C) = 38490.68 / 3 = 12830.23
            These are exactly the values returned by the studies I mentioned above.
            If you are looking for pivots based on different calculations [or simply displayed in a different manner] I would suggest that you search the forums as there are many variations that have been posted over the years by several users (myself included). If none of them fit your requirements then you will need to develop your own custom study. That is the virtue of a programmable application in as much as it allows each user to tailor a study or indicator to their individual needs and requirements.
            If you are unfamiliar with programming in EFS and are interested in learning then I would suggest that you begin by reviewing the JavaScript for EFS video series and the Core JavaScript Reference Guide. Those will provide you with a thorough introduction to programming in JavaScript which is at the foundation of EFS. Then go through the EFS KnowledgeBase and study the Help Guides and Tutorials which will provide you with the specifics of EFS.
            If at any time you have a question on a specific programming issue post it here and someone will try to assist or guide you in resolving it.
            If instead you are just looking for someone to write the scripts for you then you may want to review the FAQ: How can I get my custom study built?
            Alex


            Originally posted by rgarg99
            Hello... I saw this discusion.. Alex.. do you have the efs for calculating the prior candles daily or weekly floor trader pivot point? The ones I have have the wrong calculations... I am looking for H+L+C/3

            I cant seem to find the correct one and I have no idea how to do it myself nor want too....

            thanks
            bob

            Comment


            • #21
              Hello....surprisingly I never received an email regarding your response and esignal referred me to my own post...lol... thank you... I am looking for daily and weekly pivots ... based on those calculations... the ones I installed have different calculations and I can never seem to find the right one.. There are just too many...Please advise further!!!!!!!!!!!!!!!!!!! Muchas Gracias!!!!!

              Bob

              Comment


              • #22
                I must be an idiot...my pivot point calculations simply do not agree with these efs.. I dont understand it. Also where do we get the labels of the support/resistance to appear on the chart in standard horizontal lines? Somebody please help!

                Comment


                • #23
                  anybody here using the correct single line pivot point display that every other charting pkg has? esignal really starting to fall behind.... very sad

                  Comment


                  • #24
                    One thing you might want check, particularly if you are trading futures, is any difference between the actual close price and the settlement price. There is often a difference, sometimes very large, between the two. This is caused by the difference in price at the actual market close time and the price at the time when the settlement price is determined. Pivots should be calculated off the actual close. Unfortunately eSignal currently uses the settlement price and this can cause major problems with accurate calculation not only of the pivots but also indicators/oscillators. After a bit of a battle I've been informed that with the release of eSignal v10.2 the user will finally be able to choose whether to use the actual close or settlement price. Hope this helps.

                    Comment


                    • #25
                      Hi.. Thanks for the reply I do not trade futures... only currencies and stocks... I would like to see the \daily and weekly pivot point displayed in straight line across the graph to see floor trader support/resistance.. It is just amazing to me that esignal does not provide it...

                      Comment


                      • #26
                        The eSignal pivots are correct. If you want ONLY the day's line displayed you'll need a custom efs (as below) - thatsaid on an intraday chart that's what the eSignal ones look like. Re. naming the pivot lines - again you'd need a custom efs - but the default colours are pretty clear i.e. S/R2 is red dotted thickness2.

                        Comment


                        • #27
                          hello//

                          I would prefer straight across pivots with 3 levels labled support/resistance h+C+L/3 daily and weekly

                          Comment


                          • #28
                            The estential script is in this thread below if you want to do it yourself. Cut and paste the efs below. It hasn't got pivot names - but you don't really need them - the line colours are obvious and changeable.

                            Comment


                            • #29
                              here
                              Attached Files

                              Comment


                              • #30
                                daily
                                Attached Files

                                Comment

                                Working...
                                X