Good morning everyone
I have a question about charting the change in the $vix
I watch the a quote window and I see what the differnce is between the $ vix yesterday and the $vix today.
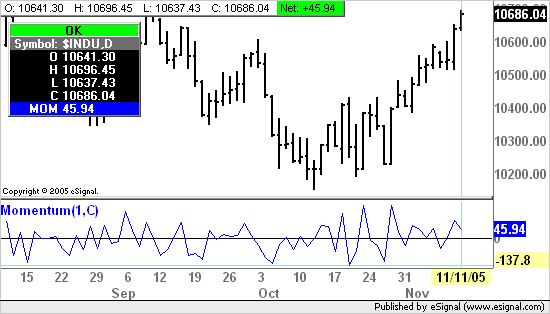
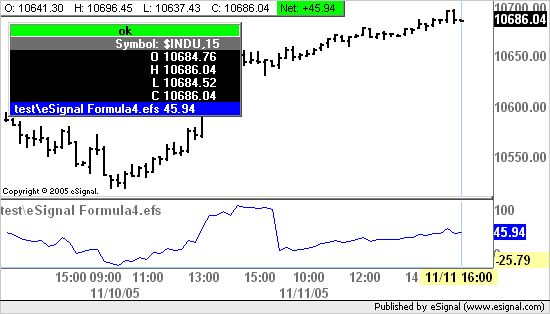
Is there a way to chart the actual changing in the symbol.
Another example might be that people watch how much the dow or nas or S&P is up or down for the day. Is there a way to chart this so I can see how it does throughout the day.
thanks ahead of time
Mark


Comment