Announcement

Collapse
No announcement yet.

MA to Symbol

Collapse
X
 
  • Filter
  • Time
  • Show
Clear All
new posts

  • MA to Symbol

    Hi everyone,

    Is it possible to have a moving average of symbol become another symbol (and thereafter be used in a symbol spread) ??

    For example, could a 10 period MA of "XYZ" be defined as a symbol "ABC" ?


    Thanks in advance!

  • #2
    george65202
    It cannot be defined as a symbol that you can use in a spread to plot price bars.
    You can however use the MA of a symbol in the context of an efs to create the spread as an indicator
    Alex

    Comment


    • #3
      Hmmmm

      Hmmm.... okay, I'll give that a try..... scratching my head... hopefully I'll work it out, but I suspect I might have one or two more novice questions to come (sorry)

      Thanks once again Alex!

      Last edited by george65202; 11-15-2005, 04:36 PM.

      Comment


      • #4
        george65202
        Feel free to ask any question you may have and if you encounter any problems with the efs you are writing post it and someone may be available to assist you.
        As to what I suggested in my prior reply that is easier than you may think if you use the EFS2 functions.
        For example the following will calculate the spread between the Close of IBM and the 10 period simple moving average of the Close of Microsoft
        close(sym("IBM")) - sma(10,close(sym("MSFT")));
        For more information on the sym() function see this article in the EFS KnowledgeBase
        Alex

        Comment


        • #5
          Alex, you've read my mind, I was just on my way back over to ask something of this sort. Thanks again, I'll go and work with this.

          Comment


          • #6
            I'm stuck. This is as far as I got, which is right at the very beginning...

            Basically, what I'm trying to do is create an oscillator which is made from a 10sma of ($VIX divided by it'a 10sma). Thanks!!!!

            --------------------

            function preMain() {

            setPriceStudy(true);
            setStudyTitle("Vix Oscillator");
            setCursorLabelName("Vix Oscillator",0);
            setDefaultBarFgColor(Color.blue,0);
            setPlotType(PLOTTYPE_LINE,0);
            setDefaultBarThickness(1,0);
            }

            function main() {

            close(sym("$VIX")) / sma(10,close(sym("VIX")));

            }

            Comment


            • #7
              george65202
              You omitted to include the return in that script ie
              return close(sym("$vix")) / sma(10,close(sym("$vix")));
              Alex

              Comment


              • #8
                reply

                Okay, I put in the return in but when I try to use the efs it just says "Vix Oscillator, Loading Data...... " and just stays like that.... there must be something else wrong, yes?

                Oh wait! Never mind...... I see something, a missing $ sign. Sorry.

                Thanks Alex, it's getting close now!!
                Last edited by george65202; 11-17-2005, 09:20 PM.

                Comment


                • #9
                  george65202
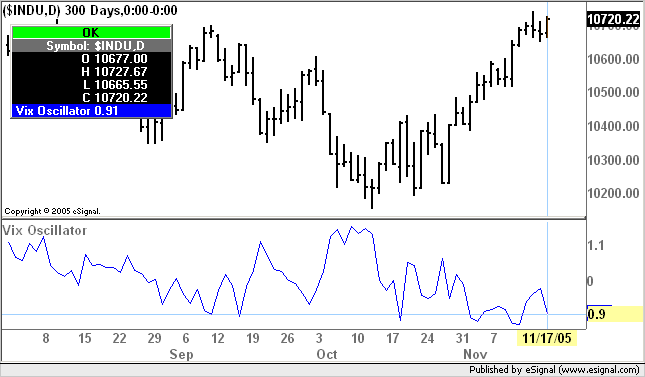
                  Seems to be working fine here (see enclosed image)
                  BTW you will want to change setPriceStudy to false
                  Alex

                  Comment


                  • #10
                    oh yeah

                    oh yeah about the setPriceStudy, got it ... yeah it's all working fine now thanks to you Alex, I feel like I'm learning quite a bit too. It really was quite a bit easier as you said.

                    Now, let me see if I can figure out how to make a moving average of that oscillator. Just looking at the code, I'm starting to get an idea.

                    Comment

                    Working...
                    X