 Tweet
Tweet
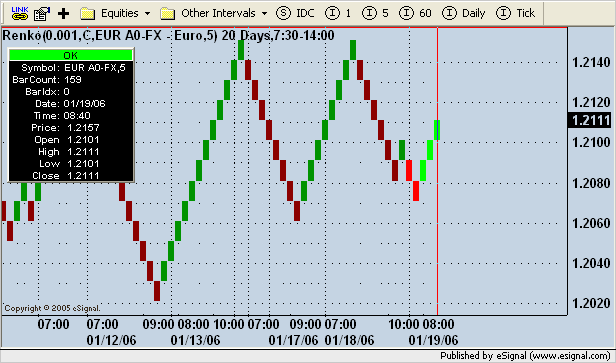
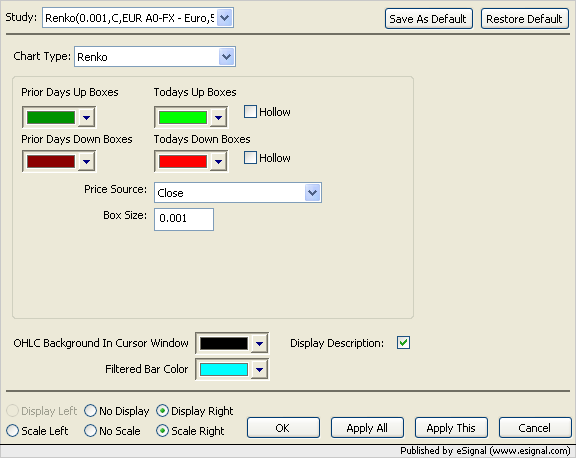
I am looking for the ability to plot the difference between the opening and the closing prices of a certain commodity, stock, etc. on an advanced chart. For example:
If I am trading the Euro Currency and I am watching a fifteen minute chart and the bar opens at 1.2100 and closes at 1.2110, I want the chart to put in a new bar at the close just as any other chart does showing that the bar closed up and has a value of +10...(closing price - opening price)
I spoke with someone in technical support and they told me to post this here. Please get back to me as soon as possible, whether to instruct me on how to create this or to walk me through a formula that you have created for me.
Thank you very much...
Jeff Shandling
Comment