Announcement

Collapse
No announcement yet.

RSI Color Line Bar

Collapse
X
 
  • Filter
  • Time
  • Show
Clear All
new posts

  • RSI Color Line Bar

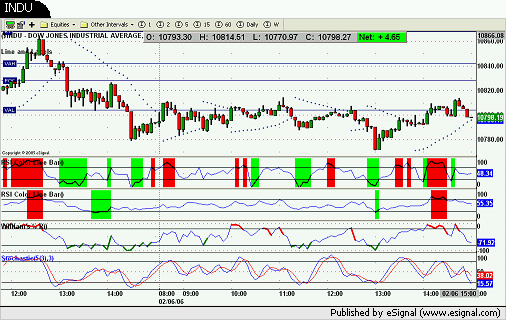
    I have lost my "Holy Grail". Some how I lost one of my settings for a different time period of the color bar RSI that you helped me with. Can't find the old post. It was a cut and paste you gave me of the existing 14 period color bar RSI (library) that I was able to enter my own time frames. Need to do it with a new Stochastics too if you don't mind (color bars that is).

    Thank You,

    Paul

    Last edited by striedel; 02-05-2006, 01:38 PM.

  • #2
    OK....Fixed the RSI problem 
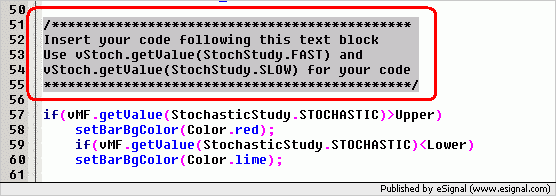
. Now I'm working on the Stochastics. Trying to get a 5-3-3 with color line bars.

    Comment


    • #3
      The last time Alexis gave me this code to modify the existing Builtin formula for Money Flow:

      Paul
      That is quite easy to implement also because you already have the upper and lower variables set up to be modified through Edit Studies ie the values used to plot the bands.
      Copy the lines enclosed in the PHP box below and paste them in the efs in between the comment section "Insert your code...etc etc" and the return statement
      Then in Edit Studies set the Upper and Lower variables to the levels you want
      Alex

      PHP:

      if(vMF.getValue(MoneyFlowStudy.MONEYFLOW)>Upper)
      setBarBgColor(Color.red);
      if(vMF.getValue(MoneyFlowStudy.MONEYFLOW)<Lower)
      setBarBgColor(Color.lime);

      I tried it with Stochastic (changing the names of course) and it didn't work. Any suggestions?

      Thanks,

      Paul

      Comment


      • #4
        Paul
        Try running a search using stochastic as the keyword and you will find several scripts that use the stochastic study to trigger different kinds of events which you can then use as an example to create your own script.
        If you are unfamiliar with programming in efs then I would suggest that you use the Formula Wizard which makes writing scripts of this kind a relatively simple task. For more information on how to use the Formula Wizard see the Formula Wizard Guide
        Alex

        Comment


        • #5
          Thanks Alexis,

          This is what I have so far that still gets errors. Any help would be greatly appreciated.

          Thanks,

          Paul

          /************************************************** *******
          Alexis C. Montenegro © July 2003
          Use and/or modify this code freely. If you redistribute it
          please include this and/or any other comment blocks and a
          description of any changes you make.
          ************************************************** ********/

          var vStoch = null

          function preMain() {
          setStudyTitle("Stochastic");
          setCursorLabelName("%K", 0);
          setCursorLabelName("%D", 1);
          setDefaultBarStyle(PS_SOLID, 0);
          setDefaultBarStyle(PS_SOLID, 1);
          setDefaultBarFgColor(Color.blue, 0);
          setDefaultBarFgColor(Color.red, 1);
          setDefaultBarThickness(1, 0);
          setDefaultBarThickness(1, 1);
          setPlotType(PLOTTYPE_LINE, 0);
          setPlotType(PLOTTYPE_LINE, 1);

          var fp1 = new FunctionParameter("K", FunctionParameter.NUMBER);
          fp1.setLowerLimit(1);
          fp1.setDefault(5); //Edit this value to set a new default

          var fp2 = new FunctionParameter("Fast", FunctionParameter.NUMBER);
          fp2.setLowerLimit(1);
          fp2.setDefault(3); //Edit this value to set a new default

          var fp3 = new FunctionParameter("Slow", FunctionParameter.NUMBER);
          fp3.setLowerLimit(1);
          fp3.setDefault(3); //Edit this value to set a new default

          var fp4 = new FunctionParameter("Upper", FunctionParameter.NUMBER);
          fp4.setLowerLimit(0);
          fp4.setDefault(80); //Edit this value to set a new default

          var fp5 = new FunctionParameter("Lower", FunctionParameter.NUMBER);
          fp5.setLowerLimit(0);
          fp5.setDefault(20); //Edit this value to set a new default

          }

          function main(K,Fast,Slow,Upper,Lower) {

          if(vStoch==null) vStoch = new StochStudy(K, Fast, Slow);
          addBand( Upper, PS_SOLID, 1, Color.black,2);
          addBand( Lower, PS_SOLID, 1, Color.black,3);

          /*********************************************
          Insert your code following this text block
          Use vStoch.getValue(StochStudy.FAST) and
          vStoch.getValue(StochStudy.SLOW) for your code
          **********************************************/

          if(vMF.getValue(StochasticStudy.STOCHASTIC)>Upper)
          setBarBgColor(Color.red);
          if(vMF.getValue(StochasticStudy.STOCHASTIC)<Lower)
          setBarBgColor(Color.lime);


          return new Array(vStoch.getValue(StochStudy.FAST),vStoch.getV alue(StochStudy.SLOW));

          }

          Comment


          • #6
            This is one of the charts I use daily. Would like for the Stochastic to look like the RSI. That's my goal anyway.

            Thanks,

            Paul


            Comment


            • #7
              Paul
              If you look at the lines just above of where you inserted your code you will see that there is a comment section (circled in red in the image enclosed below) which provides examples of the required syntax.
              In your conditional statement you need to replace every instance of vMF.getValue(StochasticStudy.STOCHASTIC) with the appropriate method depending if the conditions are to be based on %K (ie FAST) or %D (ie SLOW)
              Alex

              Comment


              • #8
                That's the ticket. Just what I wanted!!! Thank You very, very much.

                Paul

                Comment

                Working...
                X