Announcement

Collapse
No announcement yet.

MACD Histogram

Collapse
X
 
  • Filter
  • Time
  • Show
Clear All
new posts

  • MACD Histogram

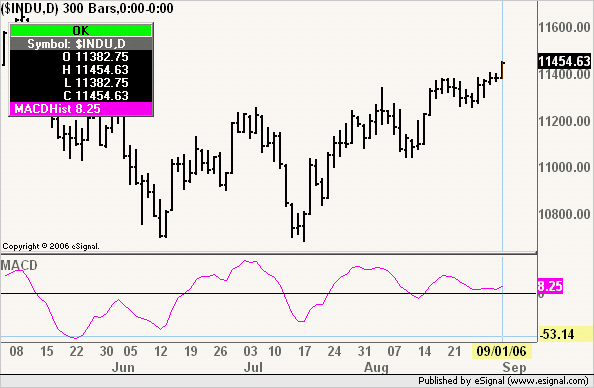
    Is there an easy way to view the MACD Histogram data as a line? I am interested in utilizing the histo data but I find it easier to read the 'line'.

    Thanks in advance!

  • #2
    tdyer89
    That option is not available in the Basic Studies MACD. However you can easily modify the MACD efs available in either the Builtin or EFS2 Custom folders to display the Histogram as a line.
    Open either efs using the Editor (Tools-> EFS-> Editor) and in preMain replace setPlotType(PLOTTYPE_HISTOGRAM,2) with setPlotType(PLOTTYPE_LINE,2). Then save the efs with a different name and load it in a chart
    Alex

    Comment


    • #3
      I understand how to make the MACDHist to display as a line, but I want know how I can get rid of the MACD Line and the MACDSig Line.

      I know how to "camflauge" it by changing the colors to white. But, I want to get rid of it all together.

      I know you can do this by coding, I just don't know how.

      Is that possible, if so, please let me know.

      Thank you.

      Comment


      • #4
        kanirajan
        If you are using the customMACD.efs which is in the EFS2 Custom folder then replace the return statement
        PHP Code:
        return new Array (getSeries(xMACD), getSeries(xMACDSig), getSeries(xMACDHist)); 
        with
        PHP Code:
        return (getSeries(xMACDHist)); 
        Also replace the following section in preMain
        PHP Code:
        setStudyTitle("MACD");
            
        setCursorLabelName("MACD",0);
            
        setCursorLabelName("MACDSig",1);
            
        setCursorLabelName("MACDHist",2);
            
        setDefaultBarFgColor(Color.blue,0); 
            
        setDefaultBarFgColor(Color.red,1);
            
        setDefaultBarFgColor(Color.magenta,2); 
            
        setPlotType(PLOTTYPE_LINE,0);
            
        setPlotType(PLOTTYPE_LINE,1);
            
        setPlotType(PLOTTYPE_HISTOGRAM,2); 
            
        setDefaultBarThickness(1,0);
            
        setDefaultBarThickness(1,1);
            
        setDefaultBarThickness(1,2);
            
        askForInput(); 
        with the following
        PHP Code:
        setStudyTitle("MACD");
            
        setCursorLabelName("MACDHist",0);
            
        setDefaultBarFgColor(Color.magenta,0); 
            
        setPlotType(PLOTTYPE_LINE,0);
            
        setDefaultBarThickness(1,0);
            
        askForInput(); 
        Once you implement these modifications you should get the plot shown in the image enclosed below
        Alex

        Comment


        • #5
          Exactly what I wanted!

          Thanks so much, Alexis.

          Comment


          • #6
            kanirajan
            You are most welcome
            Alex

            Comment

            Working...
            X