Announcement

Collapse
No announcement yet.

Some indexvolume questions

Collapse
X
 
  • Filter
  • Time
  • Show
Clear All
new posts

  • Some indexvolume questions

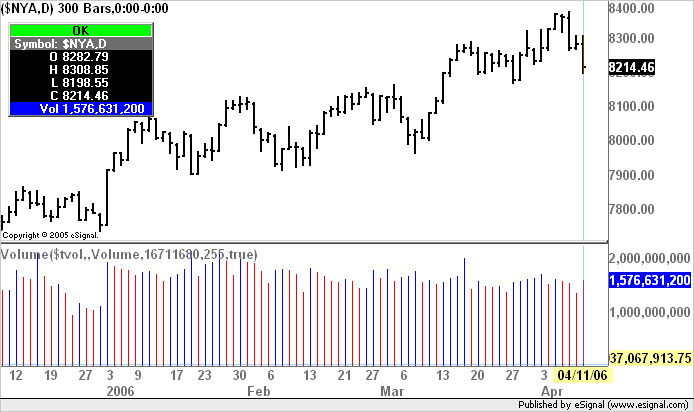
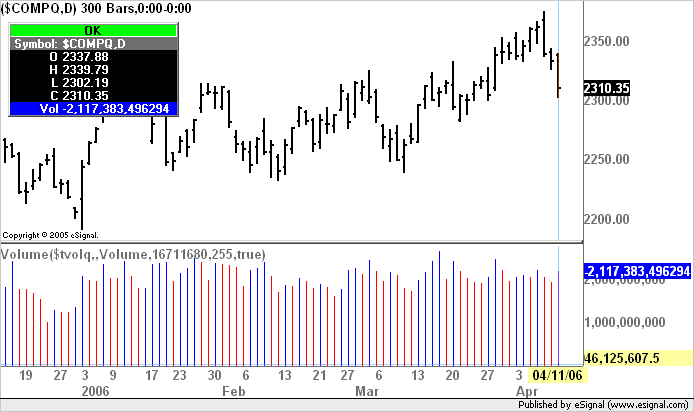
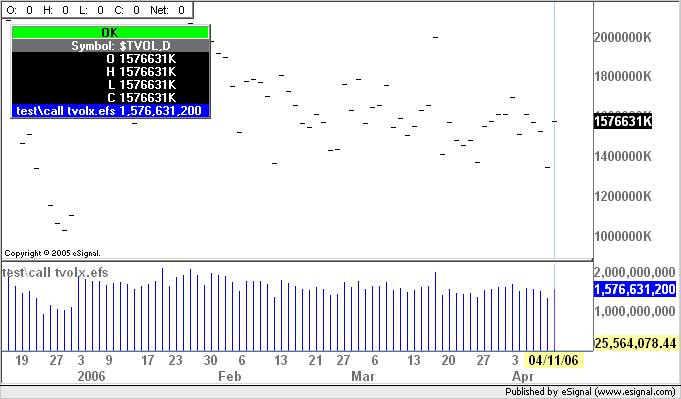
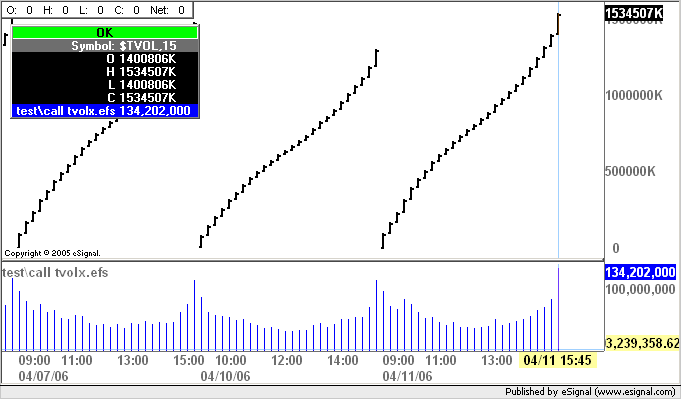
    Hi, Wondering if anyone has some guidance on getting volume for index symbols? The only index I found it to work for so far is $INDU, but I'm not sure what volume that is as it doesn't match $TVOL. I assume its for the constituent stocks but I was hoping someone knows for sure.

    I would like to be able to calculate studies using volume on the NYSE & NASDAQ but $NYA & COMPQ do not work. The efs's I've found also won't work if $TVOL is used as an override synmbol. So I am at a loss currently.

    Do I need to special code an efs to use $TVOL or is there some other way to do this?

    THanks!

    Jonathan

  • #2
    Jonathan
    If you use the customVolume.efs study that is in the EFS2 Custom folder you should be able to plot $TVOL or $TVOLQ on any chart.
    Alex


    Comment


    • #3
      Alex,
      Thanks for the reply. I was aware of that function but its not what I'm looking to do.

      I guess the easiest way to describe it is I'd like to calculate an accumulation/distribution for the S&p 500 and Nasdaq using volume on the NYSE and NASDAQ. Once I have the Acc/Dist line I can run Chaikin's studies on it.

      Any ideas there?

      Jonathan

      Comment


      • #4
        Jonathan
        Would this be for use with intraday charts?
        Alex

        Comment


        • #5
          Alex,
          Yes, it would be for all time frames hopefully. The priority is for EOD daily usage but if it were available intra day too, that would be a very valuable bonus.

          I found that most of the Dow Jones indices have volume. This may be a solution except that these indices won't directly correpspond with any tradeable instruments that I'm a aware of.

          Jonathan

          Comment


          • #6
            Jonathan
            For daily charts you could use $TVOL or $TVOLQ as a proxy for $NYA and $COMPQ volume (as indicated in my prior reply)
            With intraday charts even though you would not be able to use the Volume of $TVOL (or $TVOLQ) - because it is tick volume and not actual volume - you could still calculate the volume for each bar by subtracting the current Close of $TVOL (or $TVOLQ) - which is the cumulative volume - from its prior value. This would return the actual volume value for each bar which you can then use to create your accumulation/distribution study.
            Note that on the first bar of the day you will need to use the Close value of $TVOL (or $TVOLQ) without subtracting it from the prior bar otherwise you will get a value that is incorrect.
            As to the indexes you mention you may want to make sure that their volume is actual volume and not tick volume.
            Alex

            Comment


            • #7
              Jonathan
              Here is an example of what I suggested in my prior reply.
              The following code should be saved as tvolx.efs in the Formulas folder. This will compute the difference between the current value of the Close and its prior value except on the first bar of the day when it just uses the current Close.
              PHP Code:
              var Cntr 0;
              var 
              xClose null;

              function 
              main(symbol){
                  if(
              xClose==nullxClose close();
                  if(
              xClose.getValue(-1)==null) return;
                  if(
              getBarState()==BARSTATE_NEWBAR){
                      if(
              getDay(0)!=getDay(-1)){
                          
              Cntr 0;
                      }else{
                          
              Cntr++
                      }
                  }
                  if(
              Cntr==0){
                      var 
              xVol xClose.getValue(0);
                  }else{
                      var 
              xVol xClose.getValue(0)-xClose.getValue(-1)
                  }
                  return 
              xVol;

              Once you have this you can easily call the efs above from another formula using the efsExternal() function and pass to it the symbol $TVOL or $TVOLQ so that it will run in the context of that symbol.
              PHP Code:
              function preMain(){
              setPlotType(PLOTTYPE_HISTOGRAM)
              }

              var 
              xClose null;

              function 
              main(){
                  if(
              xClose==nullxClose efsExternal("/tvolx.efs",0,sym("$TVOL"));   
                  return 
              xClose.getValue(0);

              This will create a proxy volume series that you can then use in your accumulation/distribution calculations.
              You can see the values returned by the efs in the daily and intraday charts enclosed below
              Alex


              Comment

              Working...
              X