Announcement

Collapse
No announcement yet.

Wide range and narrow range bars

Collapse
X
 
  • Filter
  • Time
  • Show
Clear All
new posts

  • Wide range and narrow range bars

    I am trying to develop a simple study that will highlight the current bar if it is either of the following:

    1. The current bar is an inside bar (today's high is less than/equal to the prior day high and the low is greater than/equal to the prior day low) and it has the narrowest range of the last four bars (high-to-range).

    2. The current bar has the widest high-to-low range of the last seven bars.

    Help would be much appreciated. Thanks.
  • #2
    mjbaniewicz
    If you run a Search using the keyword narrow you should find some scripts that identify NR4 and WR7 bars.
    Alex

    Comment


    • #3
      Here's a bar labeller... I will label every bar - so be careful if you have 30 days of 1 minute bars loaded.....

      Try loading it onto something like 3 days of 5 minute bars.

      It's a start...

      Code:
      function preMain() {
      	setPriceStudy(true);
      
      }
      
      var grID = 0;
      function gID() {
      	grID++;
      	return grID;
      }
      
      
      var vSH = null;
      var vSL = null;
      var vSO = null;
      var vSC = null;
      var vSV = null;
      
      
      var nFontSize = 8;
      var nFontAdj  = 0.50;
      
      var aGiddieUp = new Array();
      var aGiddieDn = new Array();
      
      function main() {
      
      
      	if(vSH == null) 	vSH 		= high(); // inv(3));
      	if(vSL == null) 	vSL 		= low(); // inv(3));
      	if(vSO == null) 	vSO 		= open(); // inv(3));
      	if(vSC == null) 	vSC 		= close(); // inv(3));
      
      	var aLabelS = new Array();
      	var aLabelL = new Array();
      
      
      	var vH  = vSH.getValue(0);
      	var vL  = vSL.getValue(0);
      	var vO  = vSO.getValue(0);
      	var vC  = vSC.getValue(0);
      
      	var vPH  = vSH.getValue(-1);
      	var vPL  = vSL.getValue(-1);
      	var vPO  = vSO.getValue(-1);
      	var vPC  = vSC.getValue(-2);
      
      	var vPPH  = vSH.getValue(-2);
      	var vPPL  = vSL.getValue(-2);
      	var vPPO  = vSO.getValue(-2);
      	var vPPC  = vSC.getValue(-2);
      
      	var hl = (vH-vL);
      	var h3 = vH - (hl/3);
      	var l3 = vL + (hl/3);
      	var ov = 2;
      	var cv = 2;
      	if(vO > h3)   ov = 1;
      	if(vO < l3)   ov = 3;
      	if(vC > h3)   cv = 1;
      	if(vC < l3)   cv = 3;
      
      
      	var phl = (vPH-vPL);
      	var ph3 = vPH - (phl/3);
      	var pl3 = vPL + (phl/3);
      	var pov = 2;
      	var pcv = 2;
      	if(vPO > ph3)   pov = 1;
      	if(vPO < pl3)   pov = 3;
      	if(vPC > ph3)   pcv = 1;
      	if(vPC < pl3)   pcv = 3;


      	if(ov == 2 && cv == 2) {
      		aLabelS.push("??");
      		aLabelL.push("??");
      	} else if(ov == 3 && cv == 1) {
      		aLabelL.push("+++");
      	} else if(ov == 2 && cv == 1) {
      		aLabelL.push("++");
      	} else if(ov == 3 && cv == 2) {
      		aLabelL.push("+");
      	} else if(ov == 1 && cv == 3) {
      		aLabelS.push("---");
      	} else if(ov == 2 && cv == 3) {
      		aLabelS.push("--");
      	} else if(ov == 1 && cv == 2) {
      		aLabelS.push("-");
      	}
      
      
      	////////////////////////////////////
      	// Short
      	////////////////////////////////////
      	// These are gravestone doji
      	if(ov == 1 && cv == 1) {
      		aLabelS.push("SQT");
      		aLabelL.push("SQT");
      	}
      
      
      	if(ov == 3 && cv == 3) {
      		aLabelS.push("SQT");
      		aLabelL.push("SQT");
      	}
      
      	// indecisions - often @ top/bottom.
      	if(vO == vC) {
      		aLabelS.push("O=C");
      		aLabelL.push("O=C");
      	}
      
      
      	// black crow.
      	if(vC < vO && vPC < vPO && vPPC < vPPO) {
      		aLabelS.push("3CO");
      	}
      
      	if(vC > vO && vPC > vPO && vPPC > vPPO) {
      		aLabelL.push("3CO");
      	}
      
      
      	// the wider the range of each day, the better.
      	// even stronger if the 2nd day open < prior day close with a new daily low and a close < prior day low
      	if(vPH > vPPH && pov == 3 && pcv == 1 && ov == 1 && cv == 3) {
      		aLabelS.push("SBRD");
      	}
      
      	// the wider the range of each day, the better.
      	// even stronger if the 2nd day open < prior day close with a new daily low and a close < prior day low
      	if(vPL < vPPL && pov == 1 && pcv == 3 && ov == 3 && cv == 1) {
      		aLabelL.push("SBRD");
      	}
      
      	if(vH > vPH && vL < vPL && vC < vPC && vC < vO) {
      		aLabelS.push("ORD");
      	}
      
      	if(vL < vPL && vH > vPH && vC > vPC && vC > vO) {
      		aLabelL.push("ORD");
      	}
      
      	if(vH > vPH && vC < vO && ov == 1 && cv == 3) {
      		aLabelS.push("SD");
      	}
      
      
      	if(vL < vPL && vC > vO && ov == 3 && cv == 1) {
      		aLabelL.push("SD");
      	}
      
      	// Trend Reversal signals...
      	if(vH > vPH && vC < vPC && vC < vO) {
      		aLabelS.push("RD");
      
      	}
      
      	if(vL < vPL && vC > vPC && vC > vO) {
      		aLabelL.push("RD");
      	}


      	// more needs to be done here...
      	// Reversal confirmation. (used if you suspect reversal happened but did not see
      	// a trend reversal signal (above).
      	//if(vC < vO && vC < vPC) {
      	//	aLabelS.push("RCD");
      	//}
      
      	//if(vC > vO && vC > vPC) {
      	//	aLabelL.push("RCD");
      	//}
      
      	// Trend continuation.
      	if(vH < vPH && vL > vPL) {
      		aLabelL.push("ID");
      		aLabelS.push("ID");
      	}


      	if(getBarState() == BARSTATE_NEWBAR) {
      		aGiddieUp = new Array();
      		aGiddieDn = new Array();
      	} else {
      		for(i = 0; i < aGiddieDn.length; i++) {
      			removeText(aGiddieDn[i]);
      		}
      
      		for(i = 0; i < aGiddieUp.length; i++) {
      			removeText(aGiddieUp[i]);
      		}
      	}


      	for(i = 0; i < aLabelS.length; i++) {
      		if(i >= aGiddieDn.length) {
      			var giddie = gID();
      			aGiddieDn.push(giddie);
      		}
      
      		drawTextRelative(0,
      			high() + (i*nFontAdj),
      			aLabelS[i],
      			Color.white, Color.red,
      			Text.BOLD | Text.ONTOP | Text.BOTTOM | Text.CENTER | Text.FRAME,
      			null,
      			nFontSize,
      			aGiddieDn[i]);
      	}


      	for(i = 0; i < aLabelL.length; i++) {
      		if(i >= aGiddieUp.length) {
      			var giddie = gID();
      			aGiddieUp.push(giddie);
      		}
      
      
      		drawTextRelative(0,
      			low() - (i*nFontAdj),
      			aLabelL[i],
      			Color.black, Color.lime,
      			Text.BOLD | Text.ONTOP | Text.TOP | Text.CENTER | Text.FRAME,
      			null,
      			nFontSize,
      			aGiddieUp[i]);
      	}


      	return null;
      
      
      }
      Matt Gundersen

      Comment


      • #4
        Wow, thanks...

        I'm new to this programming language, so I really don't understand much of it (any of it, really). I'm used to TeleChart PCF language, which is really easy.

        I was able to get what I needed through the Formula Wizard believe it or not.

        The only problem I have is that sometimes the entire chart won't load (and I am using dailies). For example, the last 20 sessions or so are omitted on some of my charts. Any reason?

        Also, I am trying to write a simple script that labels a bar if the previous bar made an 8-day low and today's bar high is above yesterday's high.

        Thanks so much.

        Comment


        • #5
          mjbaniewicz

          The only problem I have is that sometimes the entire chart won't load (and I am using dailies). For example, the last 20 sessions or so are omitted on some of my charts. Any reason?
          Is this happening with the efs loaded in the chart? If yes are you painting price bars with the efs? If yes then that could be caused by your script in which case you may want to post it.
          If instead this happens without having loaded the script what symbol(s) are you trying to chart?

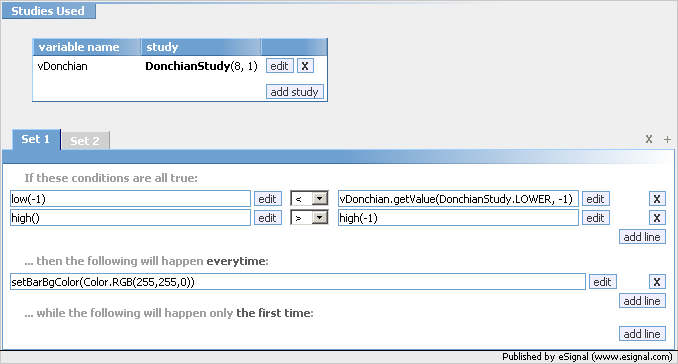
          Also, I am trying to write a simple script that labels a bar if the previous bar made an 8-day low and today's bar high is above yesterday's high.
          To do this you would need to use the Donchian Study set to a length of 8 and displaced forward by 1 period. Then you would first check if the prior bar's low broke below the Lower Donchian Channel and if the current bar's High is greater than the prior bar's High at which point you execute your command (see the example shown below)
          Alex

          Comment

          Working...
          X