Announcement

Collapse
No announcement yet.

efs study request-parabolic sar linear regression

Collapse
This topic is closed.
X
X
 
  • Filter
  • Time
  • Show
Clear All
new posts

  • efs study request-parabolic sar linear regression

    I kindly request the following efs study:

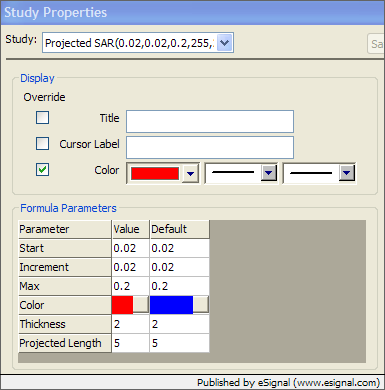
    1. Study title: SAR LINEAR REGRESSION
    2. Regular study- Indicator Parabolic SAR
    3. Detailed description:
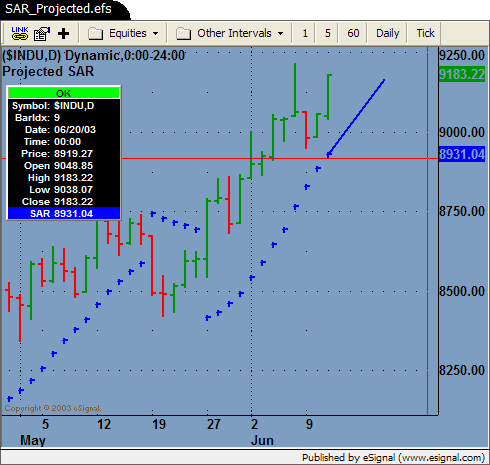
    I would like to use a linear regression of parabolic sar (4 or 5 previous sar values) and project to the nex time unit or predict the future next parabolic sar value, as shown in attached figure.
    The predicted SAR value should be displayed at each interval on the chart.

    Thank you in advance.
    Attached Files

  • #2
    Hello sugart21,

    Thank you for the formula suggestion. I've put together the initial formula. Take a look and let me know if this is what you had in mind.

    There are some formula parameters that can be changed via the "Edit Studies" option.


    You have the regular inputs for the Parabolic SAR study (Start, Increment, Max).
    Color: Changes the color of the projected line.
    Thickness: Changes the thickness of the projected line.
    Projected Length: Determines the number of future bars to project the line.

    Attached Files
    Jason K.
    Project Manager
    eSignal - an Interactive Data company

    EFS KnowledgeBase
    JavaScript for EFS Video Series
    EFS Beginner Tutorial Series
    EFS Glossary
    Custom EFS Development Policy

    New User Orientation

    Comment


    • #3
      JasonK,

      Thank you for the efs study on my requested "sar projection" idea.

      I tried to use the efs, however, not successfully so far.

      Main problems:

      1) Nothing appears on my chart when I add the efs on it as a formula and

      2) also what ever the symbol or time scale of my chart prior to applying the efs, it always converts to NVLS (time scale 30S) after adding this efs formula the efs and nothing happens.

      Please let me know at your earliest convenience.

      Thank you again.

      Comment


      • #4
        Hello sugart21,

        I believe the lowest interval you will be able to use with this formula, for now, is 1 minute.
        Jason K.
        Project Manager
        eSignal - an Interactive Data company

        EFS KnowledgeBase
        JavaScript for EFS Video Series
        EFS Beginner Tutorial Series
        EFS Glossary
        Custom EFS Development Policy

        New User Orientation

        Comment


        • #5
          Jason,

          It did not work what ever the interval I used, 1 min, 2 min, etc...
          In fact when I add this formula my chart refreshes, changes and another symbol appears without any sar projection...on it.

          I am using Esignal 7.2. What about you?

          How can it work on your chart and not on mine?


          Thank you.

          Ted

          Comment


          • #6
            Hello sugart21,

            I'm on 7.3, try upgrading and see what happens.
            Download 7.3
            Jason K.
            Project Manager
            eSignal - an Interactive Data company

            EFS KnowledgeBase
            JavaScript for EFS Video Series
            EFS Beginner Tutorial Series
            EFS Glossary
            Custom EFS Development Policy

            New User Orientation

            Comment


            • #7
              Jason,

              Thank you. I tried it on 7.3 and it works.
              However, I had requested for the display of the next bar's predicted/projected sar value to be displayed on the chart next to projected line. Can you please add this feature to the existing efs?

              Thank you in advance.

              Comment

              Working...
              X