Hi
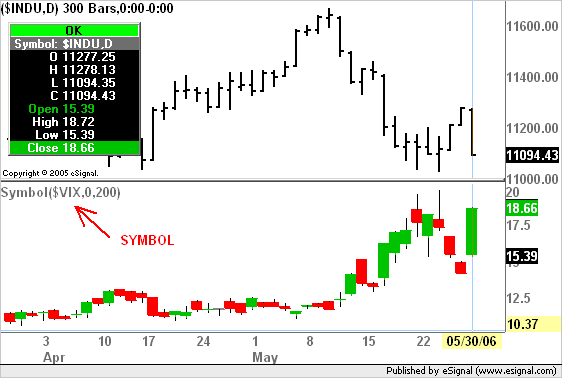
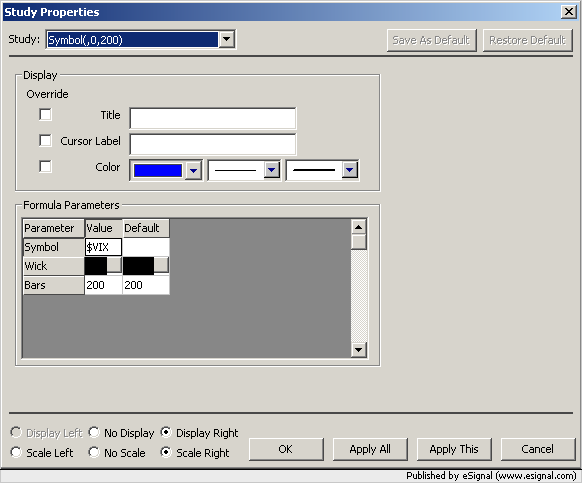
I need to be able to display symbols in the indicator panes of an advanced chart (eg $VIX underneath a chart of $INDU). To this end I have downloaded the Candlestick Indicator.efs which works fine, except it only displays candlesticks, how can I change the script so it can display both line charts or bar charts? I have virtually zero experiance in javascript unfortunately.
Also the candlestick indicator does'nt appear to show the symbol in the top left corner of the indicator pane, how can I get it to do this?
Any help here would be appreciated
Jon


Comment