Announcement

Collapse
No announcement yet.

Marking an opening range

Collapse
X
 
  • Filter
  • Time
  • Show
Clear All
new posts

  • Marking an opening range

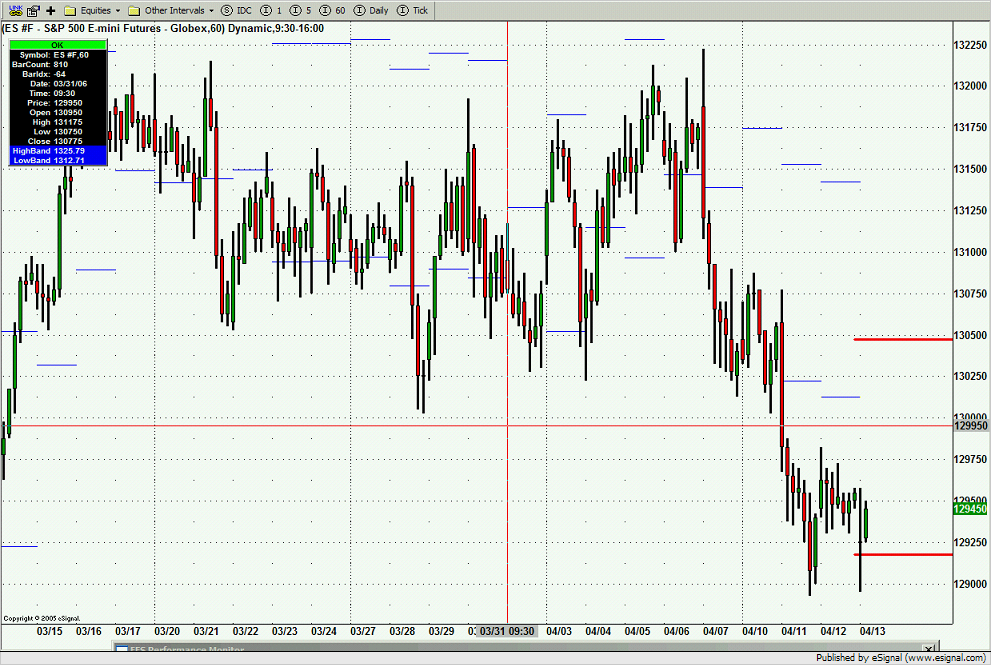
    Is there a relatively simple way to draw lines on a chart at the top and bottom of an opening range, starting the drawing at a specified time of the morning -- say 9:50 a.m., Eastern time?

    Would it also be possible to restrict the line-drawing to the current day's intra-chart?

    Thanks.

  • #2
    0steve,

    The answer to your question(s) is yes. I previously wrote and posted this small application for another forum member. It sounds similar to what you are describing. See if you can modify this to accomplish what you want.


    PHP Code:
    /***********************************************
    Provided By : Steve Hare  © April 2006                          
    EFS Formula : sBands.efs                  
    Version 1.0
    4/13/2006

    The bands are determined based on yesterdays high and todays open

    */


    function preMain() {
      
    setPriceStudy(true);
      
    setCursorLabelName("HighBand",0);
      
    setCursorLabelName("LowBand",1);
      
    setStudyTitle("sBands");
    }

    function 
    main() {
    // test in main
     
    if((day(0) != lastday)){
      
    lastday day(0);
      
    sBands(.005);
     }
     return new Array(
    HighBand,LowBand);
    }

    // global variable for function
    var todaysHighBand null;
    var 
    todaysLowBand null;
    var 
    sNum 0;
    var 
    firstIndex=0;
    var 
    HighBand=null;
    var 
    LowBand=null;
    var 
    lastday null;

    function 
    sBands(tmp){
     if (
    todaysHighBand!=null){ //this means there was a line previously
      //var rNum = sNum-15;
      //removeLineTool( LineTool.SEGMENT, "hi"+rNum );
      //removeLineTool( LineTool.SEGMENT, "lo"+rNum );
      
    addLineToolLineTool.SEGMENTfirstIndextodaysHighBandgetCurrentBarIndex(), todaysHighBand1Color.blue"hi"+sNum );
      
    addLineToolLineTool.SEGMENTfirstIndextodaysLowBandgetCurrentBarIndex(), todaysLowBand1Color.blue"lo"+sNum );
      
    sNum++;
     }
     
     
    firstIndex getCurrentBarIndex();
     
    yesterdayHigh high(-1inv("D"));
     var 
    delta open(0inv("D"))*tmp;
     
    todaysHighBand yesterdayHigh+delta;
     
    todaysLowBand yesterdayHigh-delta;
     
     
    removeLineToolLineTool.RAY"high1" );
     
    removeLineToolLineTool.RAY"low1" );
     
     
    addLineToolLineTool.RAYfirstIndex-1todaysHighBand,  firstIndextodaysHighBand3Color.red"high1" );
     
    addLineToolLineTool.RAYfirstIndex-1todaysLowBand,  firstIndextodaysLowBand3Color.red"low1" );
     
     
    HighBand todaysHighBand.toFixed(2); //convert to text value so that return statement in main does not return these values to the chart 
     
    LowBand todaysLowBand.toFixed(2);

    This can be downloaded from here:
    http://share.esignal.com/groupconten...sc&groupid=339

    Comment


    • #3
      Thank you!

      Thank you! I'll give it a shot.

      Steve

      Comment


      • #4
        Need a better approach to time specification

        What I'd like to get is the highest high value in the first 20 minutes of the security's trading day, plus the lowest low value for the same period. But my cludgy attempts to do this with an if statement and time variables keep crashing the application.

        var today = new Date();
        var h = today.getHours();
        var m = today.getMinutes();

        // Tentative code to use around 6:50 a.m., Pacific time
        // if((h == 6) && (m == 50)) {

        if((h == 22) && (m == 8)) // Code to test the idea with
        var allGo = true;

        if(allGo) {
        if(inv(2)) {
        bandHigh = hhv(10, high(0));
        bandLow = llv(10, low(0));
        }
        else if(inv(3)) {
        bandHigh = hhv(7, high(0));
        bandLow = llv(7, low(0));
        }
        else if(inv(5)) {
        bandHigh = hhv(5, high(0));
        bandLow = llv(5, low(0));
        }

        There's got to be an easier way....

        Comment


        • #5
          @0steve

          Have a look at HiLo_firstXminutes.efs


          http://share.esignal.com/ContentRoot...stXminutes.efs
          Attached Files

          Comment


          • #6
            Gracias!

            That's what I've been looking for!

            Steve

            Comment


            • #7
              How did you get that shaded area?

              TIA,

              dom

              Comment


              • #8
                dom
                You do that by using the optional yMin and yMax parameters in setBarBgColor()
                Alex

                Comment


                • #9
                  Steve,

                  That is a nice efs for your purposes, here is a link to Alex's fileshare for that efs. As to the shading, I see in my email that Alex just responded to ideaman explaining how to shade the area between the lines.
                  Last edited by ; 06-19-2006, 05:50 PM.

                  Comment

                  Working...
                  X