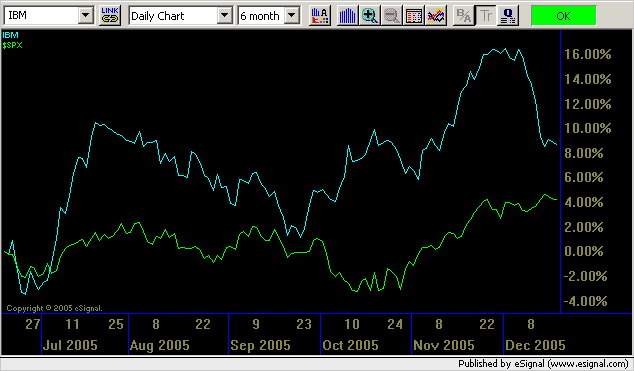
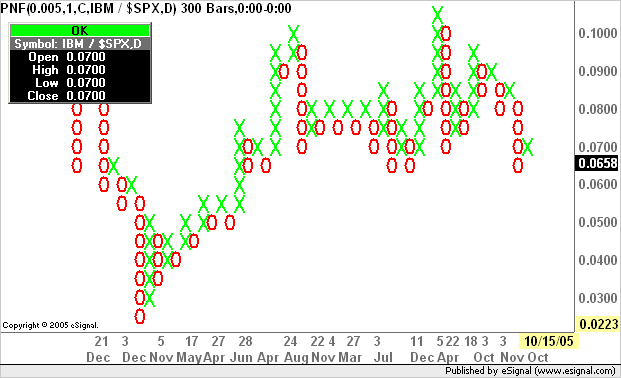
Although there are studies available to let us do one form of Relative Strenth analysis (one which produces a ratio line as a non-price study) the preferred form would be more as is already available with the symbol overlay analytics in regualr charts already in the eSignal package.
The reason I am asking that this functionality be duplicated is that the only reason at this point for my still using the normal charts is to do this type of overlay.
Now, here is the thing. Clearly you already have a model for implemnetaion, which allows both stocks in question to have ratio lines overlayed.
However an even better means of doing so would be to allow the left and right scales of the chart to show the correct respective price data for each line. Metastock for one lets you do this.


Comment