 Tweet
Tweet
Good Morning,
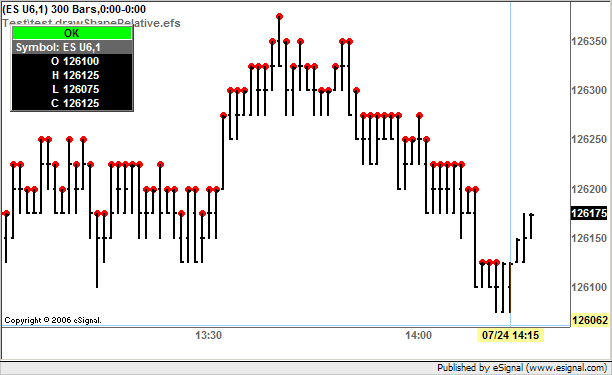
I am interested in finding a clip art or similar function that would allow the placing of spheres, rectangles or any other geometric shapes that underlie the price and study lines (Bollinger, EMA lines etc). Essentially I am looking to create visual support and resistance areas that encompass up to 1-2 pts on a chart as opposed to a simple line showing a single data point.
I would have thought a simple clip art function would have been offered, but to date, i can not find this.
Annotating these images would be a huge bonus as well.
Any help would be greatly appreciated.
Please feel free to contact me through the board, via e-mail at [email protected] or by telephone, 732-212-8820.
Thank you in advance for your help.
Comment