Announcement

Collapse
No announcement yet.

Candle Stick Indicator

Collapse
X
 
  • Filter
  • Time
  • Show
Clear All
new posts

  • Candle Stick Indicator

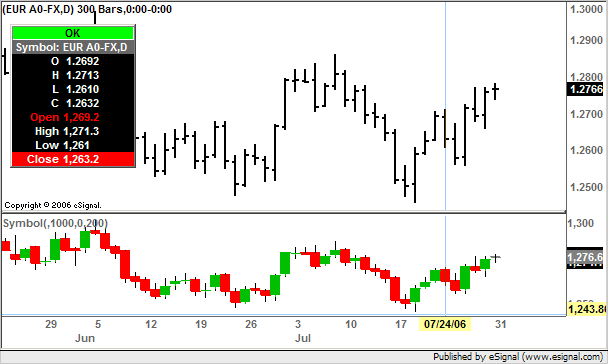
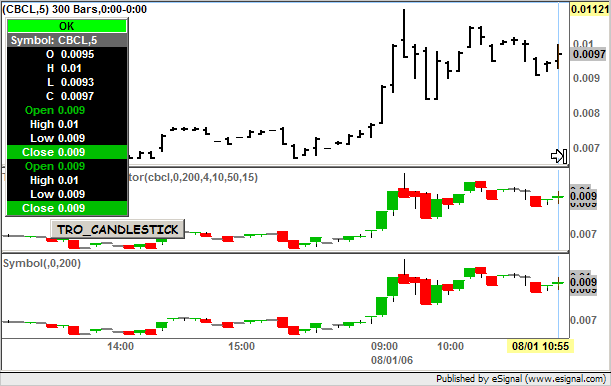
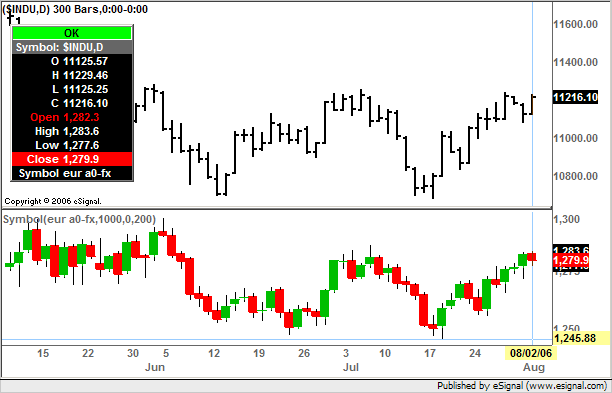
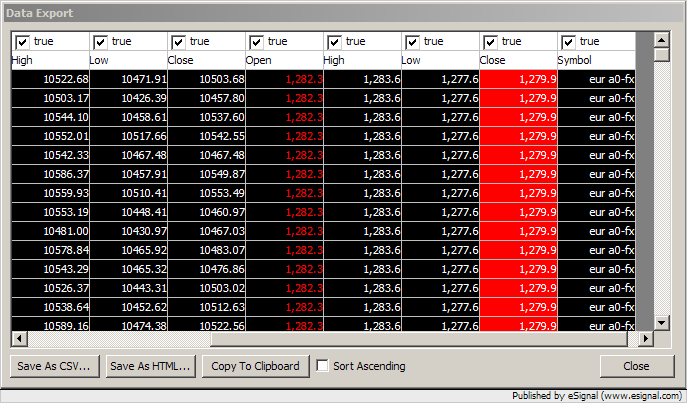
    The attached indicator was developed by Alexis a few years ago. I use it to plot the oil or gold price below currency charts or sometimes plot another curency. The problem is that it only gives values to 2 decimal places.

    Alexis (or some one who can solve this problem) can you please guide me in what code to add in order to get 4 decimal places on this indicator

    Your help will be appreciated

    Regards
    Attached Files

  • #2
    Already did this once today, so no biggie.


    PHP Code:
    /*********************************************************
    Alexis C. Montenegro © October 2005                       
    Use and/or modify this code freely. If you redistribute it
    please include this and/or any other comment blocks and a 
    description of any changes you make. 

    TRO_candlestick indicator 20060731 ADDED DECIMALS, BUTTON

    Modifying Programmer:  Avery T. Horton, Jr.  aka *************, 
                         
    **********************************************************/

    function preMain() {

        
    setPriceStudy(false);
        
    setStudyTitle("TRO_candlestick indicator");
        
    setCursorLabelName("Open"0);
        
    setCursorLabelName("High"1);
        
    setCursorLabelName("Low"2);
        
    setCursorLabelName("Close"3);
        
    setDefaultBarFgColor(Color.black0);
        
    setDefaultBarFgColor(Color.black1);
        
    setDefaultBarFgColor(Color.black2);
        
    setDefaultBarFgColor(Color.black3);
        
    setPlotType(PLOTTYPE_DOT0);
        
    setPlotType(PLOTTYPE_DOT1);
        
    setPlotType(PLOTTYPE_DOT2);
        
    setPlotType(PLOTTYPE_FLATLINES3);
        
    setDefaultBarThickness(00);
        
    setDefaultBarThickness(01);
        
    setDefaultBarThickness(02);
        
    setDefaultBarThickness(03);
        
    askForInput();


        var 
    iDecimals = new FunctionParameter("iDecimals"FunctionParameter.NUMBER);
        
    iDecimals.setDefault()


        var 
    iButtonX = new FunctionParameter("iButtonX"FunctionParameter.NUMBER);
        
    iButtonX.setDefault50 ); 

        var 
    iButtonY = new FunctionParameter("iButtonY"FunctionParameter.NUMBER);
        
    iButtonY.setDefault15 ); 


        var 
    iFontSize = new FunctionParameter("iFontSize"FunctionParameter.NUMBER);
        
    iFontSize.setDefault10 ); 

        var 
    fp1 = new FunctionParameter("Symbol"FunctionParameter.STRING);
        
    fp1.setDefault();
        
        var 
    fp2 = new FunctionParameter("Wick"FunctionParameter.COLOR);
        
    fp2.setDefault(Color.black);
        
        var 
    fp3 = new FunctionParameter("Bars"FunctionParameter.NUMBER);
        
    fp3.setDefault(200);
    }

    var 
    bInit false;
    var 
    xOpen null;
    var 
    xHigh null;
    var 
    xLow  null;
    var 
    xClose null;
    var 
    iCntr 0;
    var 
    vColor Color.black;

    function 
    main(Symbol,Wick,Bars ,
                   
    iDecimals iFontSizeiButtonXiButtonY) {

     
    // initialize upon first loading formula
        
    if(getBarState() == BARSTATE_ALLBARS) {
            
    drawTextPixel(iButtonXiButtonY" TRO_CANDLESTICK @URL=EFS:editParameters"Color.white

    Color.green
                
    Text.RELATIVETOLEFT|Text.RELATIVETOBOTTOM|Text.ONTOP|Text.BOLD|Text.BUTTON
                
    "Comic Sans MS"13"UpExp"); 
            
    vDate = new Date();
            
    vInterval getInterval();
            
    vSymbol getSymbol().toUpperCase();
        
            
    // for RTH, eg, to convert, ES Z2 to ES Z2=2
            
    var rootSymbol vSymbol.substring(0,3);
            if (
    rootSymbol == "ES " || rootSymbol == "NQ "
                if ( 
    vSymbol.indexOf("=2") == -vSymbol += "=2";
        
            
    vSymbol += ",D";
            return 
    null;
        }

        if(
    bInit==false){
            if(
    Symbol==nullSymbol getSymbol();
            
    xOpen open(sym(Symbol));
            
    xHigh high(sym(Symbol));
            
    xLow  low(sym(Symbol));
            
    xClose close(sym(Symbol));
            
    bInit true;
        }

        if (
    getBarState()==BARSTATE_NEWBAR) {
            
    iCntr++;
            if (
    iCntr>BarsiCntr 0;
        }

        var 
    nOpen xOpen.getValue(0);
        var 
    nHigh xHigh.getValue(0);
        var 
    nLow xLow.getValue(0);
        var 
    nClose xClose.getValue(0);
        
        if(
    nHigh==null||nLow==null||nOpen==null||nClose==null) return;
        
        if(
    nClose>nOpenvColor=Color.RGB(0,190,0);
        else if(
    nClose<nOpenvColor=Color.red;
        else 
    vColor=Color.grey;

        
    drawLineRelative(0nHigh0nLowPS_SOLID1Wick"Shadow"+iCntr);
        
    drawLineRelative(0nOpen0nClosePS_SOLID1vColor"Body"+iCntr);
        
    setBarBgColor(vColor,0,nOpen,nClose);
        
    setBarFgColor(vColor,3)

        return new Array ( 
    rnd(nOpeniDecimals), rnd(nHighiDecimals), rnd(nLowiDecimals), rnd(nClose

    iDecimals)   ); 
    }


    function 
    editParameters() {
        
    askForInput("TRO_CANDLESTICK");
        return;
    }


    // rnd function - round to iDecimals places
    function rnd(valueiDecimals ) {  

    value =  value Math.pow(10iDecimals);

        return 
    Math.round(valueiDecimals) / Math.pow(10iDecimals);

    Attached Files

    Comment


    • #3
      Avery

      It is still only plotting 2 decimals, any reason?
      Attached Files

      Comment


      • #4
        Avery

        I also do not understand what the following mean:

        // for RTH, eg, to convert, ES Z2 to ES Z2=2
        var rootSymbol = vSymbol.substring(0,3);
        if (rootSymbol == "ES " || rootSymbol == "NQ ")
        if ( vSymbol.indexOf("=2") == -1 ) vSymbol += "=2";

        Can you please explain so that I can understand?

        Regards

        Comment


        • #5
          Kobus
          At this time efs does not offer the option to increase the number of decimals in a plot.
          The only solution currently available is to adjust the returned values using a multiplier (in the case of currencies for example use 1000 which is what I set as the default). The enclosed revision should approximate the result that you want
          Alex

          Attached Files

          Comment


          • #6
            Kobus
            That section of code converts an ES my or NQ my symbol to its to its RTH equivalent by adding an =2 at the end of the symbol ie. ES my=2 or NQ my=2. FWIW it is not used in the context of that script
            Alex


            Originally posted by FX989231

            I also do not understand what the following mean:

            // for RTH, eg, to convert, ES Z2 to ES Z2=2
            var rootSymbol = vSymbol.substring(0,3);
            if (rootSymbol == "ES " || rootSymbol == "NQ ")
            if ( vSymbol.indexOf("=2") == -1 ) vSymbol += "=2";

            Comment


            • #7
              Kobus
              I just realized I set the default value for Factor at 100 and have replaced the attachment. You can download it again or just change the default value to 1000
              Alex

              Comment


              • #8
                Alex

                Thank you it looks much better than before.

                One more question:

                When you export data using TOOLS> DATA EXPORT, is there a way of exporting the name of the symbol or indicator with the data?

                At the moment it looks like this;
                Attached Files

                Comment


                • #9
                  Alexis or anyone:

                  Can you explain why my solution worked for equities but not forex?

                  For the stock I plotted, if you don't specify 3 or more decimals, then it only plots to 2 decimal places.

                  But when you enter 3 or more it plots correctly.

                  Thanking You in Advance.

                  Comment


                  • #10
                    buzzhorton
                    Actually it does not work for equities either if you try to increase the number of decimals beyond what the formula engine will itself display. If you look at the image you posted you will see that the last price is 0.0074 while the efs is displaying 0.007 even though it is set to 4 decimals.
                    Enclosed is another snapshot of your version of the efs together with the original version and as you can see both return the same exact number of decimals (even though the latter is not set to return any specific number of decimals)
                    Alex

                    Comment


                    • #11
                      Kobus
                      I don't think the Data Export Tool has a way to include the symbol in its output.
                      However there is a workaround which is to add the symbol as a string in the returned array of the efs (see enclosed revision of the script). In this way the symbol will display in the Cursor Window and is also available to the Data Export Tool (see enclosed images)
                      Alex


                      Attached Files

                      Comment


                      • #12
                        Thanks for explaining, Alexis.

                        Originally posted by Alexis C. Montenegro
                        [B]buzzhorton
                        Actually it does not work for equities either if you try to increase the number of decimals beyond what the formula engine will itself display. If you look at the image you posted you will see that the last price is 0.0074 while the efs is displaying 0.007 even though it is set to 4 decimals.
                        Enclosed is another snapshot of your version of the efs together with the original version and as you can see both return the same exact number of decimals (even though the latter is not set to return any specific number of decimals)
                        Alex

                        Comment


                        • #13
                          Alex

                          Thank you very much, its perfect.

                          Once again I want to express my appreciation for your dedication and your outstanding knowledge.

                          Regards

                          Comment


                          • #14
                            Kobus
                            You are most welcome and thank you for the compliments
                            Alex

                            Comment


                            • #15
                              Candle stick, plot line instead

                              Can any one specify changes to thie clever candle stick indicator efs that will plot a price line, like at close or hcl/3 rather than the simulated candle sticks. Appreciate any guidance.
                              Venture

                              Comment

                              Working...
                              X