Announcement

Collapse
No announcement yet.

Can you help identify these bands?

Collapse
X
 
  • Filter
  • Time
  • Show
Clear All
new posts

  • #16
    Re: Smoothed Moving Average

    Originally posted by Jharvey407
    Yes buzz, I did see that.

    I am not sure what your point is though, as I have stated repeatedly, I am looking for the formula for the

    Smoothed Moving Average

    and what you have directed me too is a smoothed RSI.
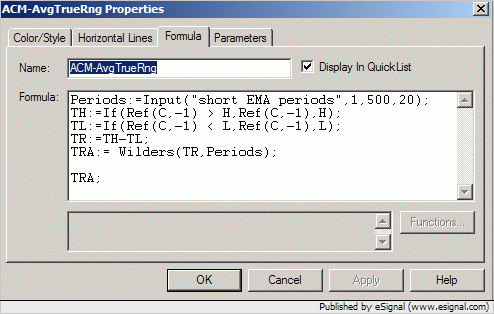
    Inside that code is how WILDER'S SMOOTHS!!

    Comment


    • #17


      Technical Studies

      Smoothed Moving Average
      A Smoothed Moving Average is an Exponential Moving Average, only with a longer period applied. The Smoothed Moving Average gives the recent prices an equal weighting to the historic ones. The calculation does not refer to a fixed period, but rather takes all available data series into account. This is achieved by subtracting yesterday’s Smoothed Moving Average from today’s price. Adding this result to yesterday’s Smoothed Moving Average, results in today’s Moving Average.

      Properties

      Period. The number of bars in a chart. If the chart displays daily data, then period denotes days; in weekly charts, the period will stand for weeks, and so on. The application uses a default of 9. However, to smooth the Moving Average, the period specified is lengthened: Period=2*n-1.

      Aspect: The Symbol field on which the study will be calculated. Field is set to "Default", which, when viewing a chart for a specific symbol, is the same as "Close".

      Interpretation

      A Smoothed Moving Average is another type of Moving Average. In a Simple Moving Average, the price data have an equal weight in the computation of the average. Also, in a Simple Moving Average, the oldest price data are removed from the Moving Average as a new price is added to the computation. The Smoothed Moving Average uses a longer period to determine the average, assigning a weight to the price data as the average is calculated. Thus, the oldest price data in the Smoothed Moving Average are never removed, but they have only a minimal impact on the Moving Average.

      The main use of this study is its smoothing out function. In this way, the Moving Average removes short-term fluctuations and leaves to view the prevailing trend.

      Moving Averages work best in trending markets. A buy signal occurs when the short and intermediate term averages cross from below to above the longer term average. Conversely, a sell signal is issued when the short and intermediate term averages cross from above to below the longer term average. You can use the same signals with two Moving Averages, but most market technicians suggest using longer term averages when trading only two Smoothed Moving Averages in a crossover system.

      Another trading approach is to use the current price concept. If the current price is above the Smoothed Moving Averages, you buy. Liquidate that position when the current price crosses below either Moving Average. For a short position, sell when the current price is below the Smoothed Moving Average. Liquidate that position when the current price rises above the Smoothed Moving Averages.

      As you use Smoothed Moving Averages, do not confuse them with Simple Moving Averages. A Smoothed Moving Average behaves quite differently from a Simple Moving Average. It is a function of the weighting factor or length of the average.

      Literature

      Murphy, John J. Technical Analysis of the Futures Markets. New York Institute of Finance. Englewood Cliffs, NJ. 1986.

      Wilder, J. Welles. New Concepts in Technical Trading Systems. Greensboro, NC: Trend Research, 1978.

      Kaufman, P. J. Technical Analysis in Commodities.

      Kaufman, Perry J. The New Commodity Trading System and Methods. 1987.

      Murphy, John J. The Visual Investor. New York, NY: John Wiley & Sons, Inc. 1996.

      Maxwell, J. R. Commodity Futures Trading with Moving Averages. 1976.

      Colby, Robert F., Myers, Thomas. A. The Encyclopedia of Technical Market Indicators. Dow Jones – Irwin. Homewood, IL. 1988.

      Pring, Martin J. Technical Analysis Explained.

      Lebeau, Charles, and Lucas, David. Technical Trader’s Guide to Computer Analysis of the Futures Market. Homewood, IL: Business One Irwin. 1991.
      Attached Files

      Comment


      • #18
        Thanks Buzz you finally provided something I can use. I appreciate it.

        Thanks

        Comment


        • #19
          I have a signaling efs using this indicator posted at the weekend on my fileshare:


          This uses Ehlers smoothing - but they may be similar/same.

          Paul.

          Comment


          • #20
            Originally posted by Jharvey407
            Thanks Buzz you finally provided something I can use. I appreciate it.

            Thanks
            You're welcome.

            Please post your study when you're done coding.

            Comment


            • #21
              Thanks for the help guys.

              I just got back from a flyfishing trip to Alaska and should finish the scripting this weekend.

              I'll post what I come up with.

              James

              Comment


              • #22
                James
                FWIW you don't necessarily have to compute Wilder's smoothing of the True Range because eSignal's atr() function already uses that in its calculations.
                In fact if you look at the following screenshot you will see that the plots of the ATR in Metastock and in eSignal match exactly.


                In the next image you can see the formula I used in Metastock (which is the same one you posted in your first message)


                and enclosed below is the eSignal script in which I also compute the ATR using the equivalent of Wilder's smoothing ie ema((period*2)-1,source). The only difference you should see between these two methods is at the beginning of the plot due to the different priming.

                PHP Code:
                function preMain(){
                    
                setCursorLabelName("Wilder ATR",0);
                    
                setCursorLabelName("eSignal ATR",1);
                }

                var 
                TR null;
                var 
                WilderATR null;
                var 
                ATR null;

                function 
                main(Length){
                    if(
                Length==nullLength 20;
                    
                    if(
                TR==nullTR atr(1);//True Range
                    
                if(WilderATR==nullWilderATR ema((Length*2)-1,TR);//Average True Range using Wilder smoothing
                    
                if(ATR==nullATR atr(Length);//esignal Average True Range
                    
                    
                return new Array (WilderATR.getValue(0), ATR.getValue(0));

                As a confirmation the next screenshot shows the bands plotted in Metastock using the formula you posted and in eSignal using the script I posted. As you can see the values are the same
                Alex

                Comment


                • #23
                  Thanks

                  Alexis,

                  Thanks for the info. I wasn't planning on computing the smoothing for the ATR. I was looking for the formula for his Moving Average so that I could script my own Alligator. The scripts I have downloaded don't match the charts on the Profitunity web site and I am trying to figure out why.

                  As usual though, you scripts and comments have been a vauluable source of information.

                  Thanks
                  James

                  Comment

                  Working...
                  X