 Tweet
Tweet
if you have a 1-min chart, and you have an efs that draws stochastics on it, can you code efs to draw the value of stochastics that at the current bar you would see if you had a 10-min chart opened, that is on the **same** 1 min chart?
-
-
Yes, you can. -
Does anyone have some sample code of how to do this?Originally posted by buzzhorton
Yes, you can.Comment
-
You question prompted me to try something...Originally posted by alexmihh
Does anyone have some sample code of how to do this?
AND IT WORKED!
In the iStudy input of my TRO_SAK2 indicator, you can add ,inv(10)
to the study!
This ability makes the TRO STUDIES that much more flexible!!
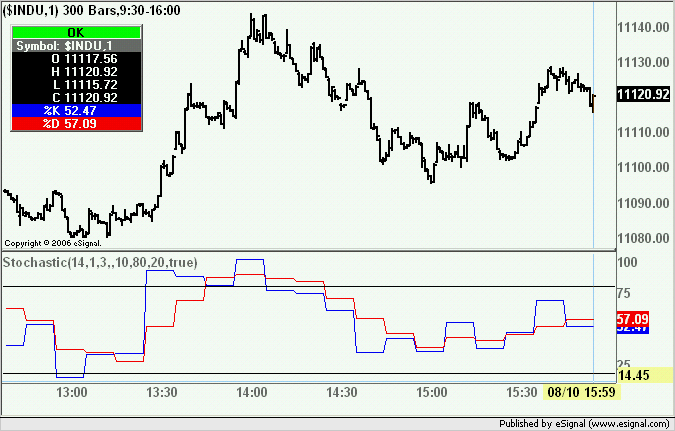
Notice on the 1 minute chart how the 10 minute stochastic.. plots a flat line until the next 10 minute bar opens.
THIS IS REALLY COOL!Attached FilesComment
-
-
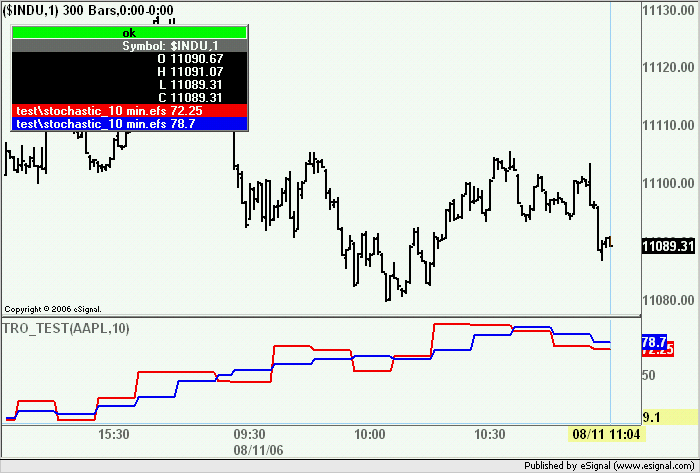
I made a 2 row version considering stochastics is usually a 2 line plot.Attached FilesComment
-
-
Can you save me some time and show me the part of efs code you used to do this? -- that is to draw a non 1 min Stohastic value on a 1 min chart (for example)Originally posted by buzzhorton
I made a 2 row version considering stochastics is usually a 2 line plot.Comment
-
alexmihh
In its most basic form a Stochastic study based on 10 minute data is written as follows
The interval on which the study is based is defined by the inv() function (see link for syntax and examples)PHP Code:function main(){
return new Array ( stochK(14,1,3,inv(10)), stochD(14,1,3,inv(10)) );
}
In your computer you can find an example of each builtin study in the EFS2 Custom folder of Formulas.
All those scripts include user adjustable parameters and are enabled for use with multiple intervals and/or external symbols
Alex
Comment
-
Originally posted by Alexis C. Montenegro
alexmihh
In its most basic form a Stochastic study based on 10 minute data is written as follows
The interval on which the study is based is defined by the inv() function (see link for syntax and examples)PHP Code:function main(){
return new Array ( stochK(14,1,3,inv(10)), stochD(14,1,3,inv(10)) );
}
In your computer you can find an example of each builtin study in the EFS2 Custom folder of Formulas.
All those scripts include user adjustable parameters and are enabled for use with multiple intervals and/or external symbols
Alex
Alexis,
What would be the syntax for changing that statement to access and external symbol? Thanks very much.Glen Demarco
[email protected]Comment
-
demarcog
To do that you would use the sym() function (see link for syntax and examples)
Alex
PHP Code:function main(){
return new Array ( stochK(14,1,3,sym("IBM")), stochD(14,1,3,sym("IBM")) );
}
Comment
-
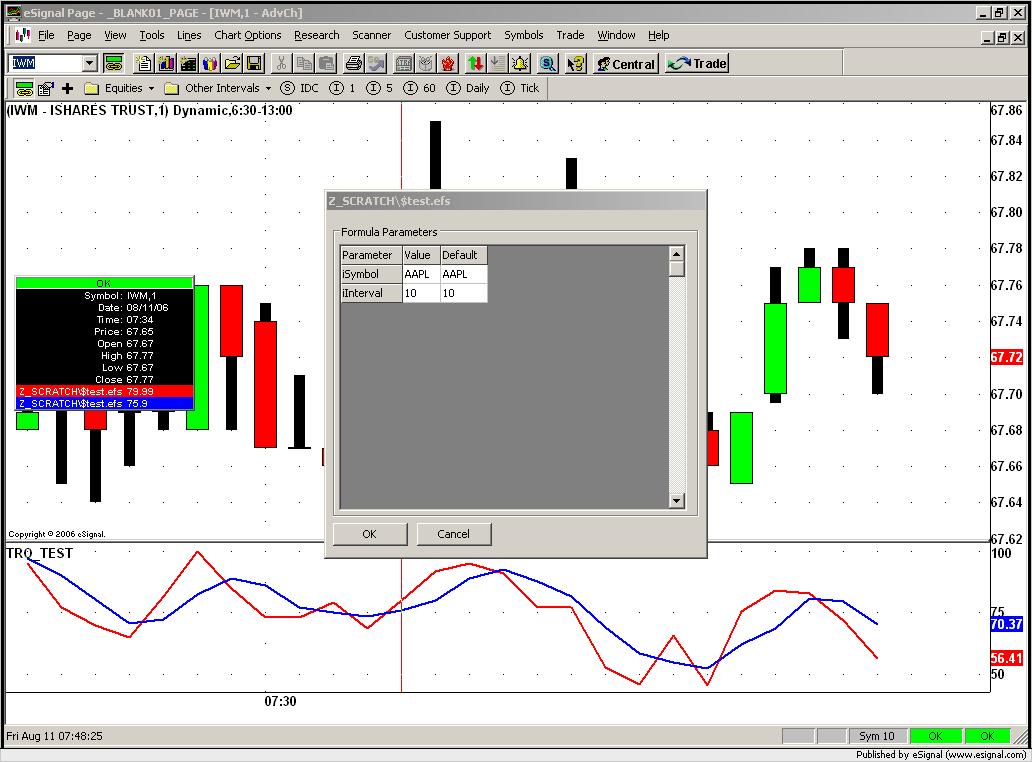
This may help.
I wrote a test study to see if you can use both the sym() and inv() in the same study... AND YOU CAN!
That will solve one of the problems I was having when building internal/external calls.
But back to main subject.
Notice, IWM is being charted but the stochastics for AAPL on a 10 minute interval are being displayed:
PHP Code:function preMain() {
setPriceStudy(false);
setStudyTitle("TRO_TEST");
setDefaultBarFgColor(Color.red,0);
setDefaultBarFgColor(Color.blue,1);
setDefaultBarThickness(2,0);
setDefaultBarThickness(2,1);
}
var iSymbol = new FunctionParameter("iSymbol", FunctionParameter.STRING);
iSymbol.setDefault( "AAPL" );
var iInterval = new FunctionParameter("iInterval", FunctionParameter.NUMBER);
iInterval.setDefault( 10 );
askForInput();
function main(iSymbol, iInterval ){
return new Array ( stochK(14,1,3,sym(iSymbol), inv(iInterval)), stochD(14,1,3,sym(iSymbol), inv(iInterval)) );
}
Attached FilesComment
-
-
buzzhorton
Actually the script you posted will not work correctly and in fact the plot shown on your chart is not that of a 10 minute Stochastic of AAPL
The correct code is enclosed below together with an image showing the Stochastic based on the 10 minute data of AAPL
Anyhow as I indicated in my prior reply the customStoch.efs and other studies contained in the EFS2 Custom folder are already enabled to compute the studies based on external symbols and/or intervals and have all the significant parameters set to be user adjustable
Alex
PHP Code:function preMain() {
setPriceStudy(false);
setStudyTitle("TRO_TEST");
setDefaultBarFgColor(Color.red,0);
setDefaultBarFgColor(Color.blue,1);
setDefaultBarThickness(2,0);
setDefaultBarThickness(2,1);
var iSymbol = new FunctionParameter("iSymbol", FunctionParameter.STRING);
iSymbol.setDefault( "AAPL" );
var iInterval = new FunctionParameter("iInterval", FunctionParameter.NUMBER);
iInterval.setDefault( 10 );
askForInput();
}
function main(iSymbol, iInterval ){
return new Array ( stochK(14,1,3,sym(iSymbol+","+iInterval)), stochD(14,1,3,sym(iSymbol+","+iInterval)) );
}
Originally posted by buzzhorton
This may help.
I wrote a test study to see if you can use both the sym() and inv() in the same study... AND YOU CAN!
That will solve one of the problems I was having when building internal/external calls.
But back to main subject.
Notice, IWM is being charted but the stochastics for AAPL on a 10 minute interval are being displayed:
PHP Code:function preMain() {
setPriceStudy(false);
setStudyTitle("TRO_TEST");
setDefaultBarFgColor(Color.red,0);
setDefaultBarFgColor(Color.blue,1);
setDefaultBarThickness(2,0);
setDefaultBarThickness(2,1);
}
var iSymbol = new FunctionParameter("iSymbol", FunctionParameter.STRING);
iSymbol.setDefault( "AAPL" );
var iInterval = new FunctionParameter("iInterval", FunctionParameter.NUMBER);
iInterval.setDefault( 10 );
askForInput();
function main(iSymbol, iInterval ){
return new Array ( stochK(14,1,3,sym(iSymbol), inv(iInterval)), stochD(14,1,3,sym(iSymbol), inv(iInterval)) );
}
Comment
-
Moving Study to Price via EFS
[QUOTE]Originally posted by Alexis C. Montenegro
[B]buzzhorton
The correct code is enclosed below together with an image showing the Stochastic based on the 10 minute data of AAPL
Uh, sort of a different question, but can these Stohastics value, which do not have price values, be drawn on the price chart?
That is, can we do with EFS what we do manually with our charts when we drag a study into the price chart with holding down the Shirt key, superimposing the study over the price bars?Comment
-
alexmihh
If you are asking whether there is an efs function that will alow to overlay a study (just as you would do manually) then the answer is no there is no such function available at this time
AlexComment
-
Yeah, that was my question, and I sort of figured on your answerOriginally posted by Alexis C. Montenegro
alexmihh
If you are asking whether there is an efs function that will alow to overlay a study (just as you would do manually) then the answer is no there is no such function available at this time
AlexComment
-
alexmihh
If you would like to submit that suggestion you may want to send an email to [email protected] or use the Make A Suggestion function which is available in the main menu of eSignal under Customer Support
AlexComment
Comment