Announcement

Collapse
No announcement yet.

Indicator on C-L

Collapse
X
 
  • Filter
  • Time
  • Show
Clear All
new posts

  • Indicator on C-L

    Hello,

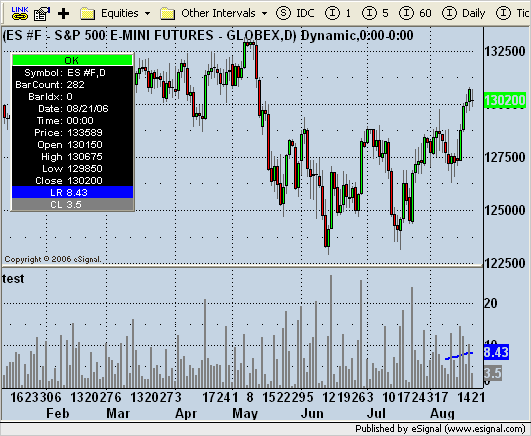
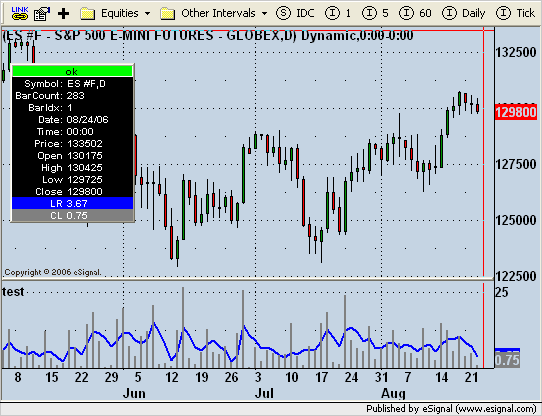
    i want to make a plot of the Linear Regression function applied on C-L.
    Not on the Close or the high etc.

    How can i do this with Formula Wizard. I can only choose OHLC and if i try to change the formula by putting it into the code by hand, then it gives error message.

    Thank you in advance.

    Robert

  • #2
    Hello Robert,

    Unfortunately, the limitations of the Formula Wizard will not allow you to create this study. This will have to be done in the EFS Editor.

    With our latest EFS2 capabilities, this type of study is fairly simple to create. Prior to EFS2 this process would have been a couple hundred lines of code.

    What you do is create a series based on the C-L. Then you can pass that series as the source for the LR studies. To turn the C-L into a series you just put that calculation into it's own function and then assign it to a global variable through an efsInternal() call. Then you pass that global variable (xCL in the code example below) to the source parameter of the middleLinearReg() study for example. Try the following.

    PHP Code:
    function preMain() {
        
    //setPriceStudy(true);
        
    setStudyTitle("test");
        
    setCursorLabelName("LR"0);
        
    setCursorLabelName("CL"1);
        
    setDefaultBarThickness(20);    
        
    setDefaultBarThickness(21);    
        
    setPlotType(PLOTTYPE_HISTOGRAM1);
        
    setDefaultBarFgColor(Color.blue0);
        
    setDefaultBarFgColor(Color.grey1);
    }

    var 
    xCL     null;
    var 
    xLRofCL null;
    var 
    bInit   false;

    function 
    main() {
        if (
    bInit == false) {
            
    // initialize series at start up
            
    xCL     efsInternal("calcCL");
            
    xLRofCL middleLinearReg(101xCL);
            
    bInit true;
        }
        
        var 
    nLR xLRofCL.getValue(0);
        var 
    nCL xCL.getValue(0);
        
        return new Array(
    nLRnCL);
    }


    function 
    calcCL() {
        return 
    close(0) - low(0);

    Jason K.
    Project Manager
    eSignal - an Interactive Data company

    EFS KnowledgeBase
    JavaScript for EFS Video Series
    EFS Beginner Tutorial Series
    EFS Glossary
    Custom EFS Development Policy

    New User Orientation

    Comment


    • #3
      Thank you Jason.

      I tried your formula, but i get error message in the line with the function call

      xCL = efsInternal("calcCL";

      saying "Formula File not found".

      But i copied the whole thing including function calcCL .

      Comment


      • #4
        Hello Robert,

        Looks like you may just be missing the close parenthesis at the end of the efsInternal call and before the semicolon.

        xCL = efsInternal("calcCL");

        If that does not solve the problem, attach your formula and I'll take a look.
        Jason K.
        Project Manager
        eSignal - an Interactive Data company

        EFS KnowledgeBase
        JavaScript for EFS Video Series
        EFS Beginner Tutorial Series
        EFS Glossary
        Custom EFS Development Policy

        New User Orientation

        Comment


        • #5
          Hi Jason,

          the parenthesis is there.

          BUT:
          when i started eSignal again, and opened the formula with the editor i did not get the error message anymore.

          Now the formula works well.
          Thank you very much.

          Regards
          Robert

          Comment


          • #6
            You're most welcome.
            Jason K.
            Project Manager
            eSignal - an Interactive Data company

            EFS KnowledgeBase
            JavaScript for EFS Video Series
            EFS Beginner Tutorial Series
            EFS Glossary
            Custom EFS Development Policy

            New User Orientation

            Comment


            • #7
              Hello Jason,

              one more question:
              i want to get the plots of middlelinearreg not only for the last period-bars but for all bars. For every bar in the past the linearreg calculated i.e. over the 9 bar period.

              How can i do this?
              I attached the formulafile i created after your example and would like to see the lines under all bars not only the last 9 bars.

              Regards
              Robert
              Attached Files

              Comment


              • #8
                Hello Robert,

                To get the moving linear regression line, we cannot use the built-in studies. We have to code the LR calculation and base it on the xCL series. Alex had posted an LR study in one of his threads, How easy are studies on studies in EFS2?. The code below uses his main() from the LR.efs as the movingLR() series. The only difference is that we're replacing the source for the function with the xCL series. Try it out.

                PHP Code:
                function preMain() {
                    
                //setPriceStudy(true);
                    
                setStudyTitle("test");
                    
                setCursorLabelName("LR"0);
                    
                setCursorLabelName("CL"1);
                    
                setDefaultBarThickness(20);    
                    
                setDefaultBarThickness(21);    
                    
                setPlotType(PLOTTYPE_HISTOGRAM1);
                    
                setDefaultBarFgColor(Color.blue0);
                    
                setDefaultBarFgColor(Color.grey1);
                }

                var 
                xCL     null;
                var 
                xLRofCL null;
                var 
                xMovLR  null;
                var 
                bInit   false;

                function 
                main() {
                    if (
                bInit == false) {
                        
                // initialize series at start up
                        
                xCL     efsInternal("calcCL");
                        
                xLRofCL middleLinearReg(101xCL);
                        
                xMovLR  efsInternal("movingLR"10xCL);
                        
                bInit true;
                    }
                    
                    var 
                nMovLR xMovLR.getValue(0);
                    var 
                nCL xCL.getValue(0);
                    
                    return new Array(
                nMovLRnCL);
                }


                function 
                movingLR(length,source) { 
                    if(
                length==nulllength 10;
                    
                //if(source==null) source = efsInternal("calcCL");
                    //else source = eval(source);//see Notes in the IE/2 script
                    
                    
                var sum 0;
                    if (
                source.getValue(-(length)) == null){
                        return;
                    }
                    for (var 
                i=lengthi>0i--){
                        
                sum += (i-(length+1)/3)*source.getValue(i-(length)); 
                    }
                    var 
                LR 6/(length*(length+1))*sum;
                    return (
                LR);
                }


                function 
                calcCL() {
                    return 
                close(0) - low(0);


                Jason K.
                Project Manager
                eSignal - an Interactive Data company

                EFS KnowledgeBase
                JavaScript for EFS Video Series
                EFS Beginner Tutorial Series
                EFS Glossary
                Custom EFS Development Policy

                New User Orientation

                Comment


                • #9
                  Thank you Jason.
                  Exactly what i needed.
                  Now the indicator works well even with Tickreplay. Great.

                  Regards
                  Robert

                  Comment


                  • #10
                    You're most welcome.
                    Jason K.
                    Project Manager
                    eSignal - an Interactive Data company

                    EFS KnowledgeBase
                    JavaScript for EFS Video Series
                    EFS Beginner Tutorial Series
                    EFS Glossary
                    Custom EFS Development Policy

                    New User Orientation

                    Comment

                    Working...
                    X