Announcement

Collapse
No announcement yet.

File sharing

Collapse
X
 
  • Filter
  • Time
  • Show
Clear All
new posts

  • File sharing

    Good morning,

    I have few question about EFS file sharing.

    I have downloaded the following files:

    1) Positive volume- Negative volume
    2) Volume with MA

    R1)What's postive volume? Is it refers to the close of the bars or
    to the previous day volume? I suppose neither of these
    answers.
    Can you help me?

    R2) About volume with MA, simply plot on the volume indicator a
    simple moving average?


    3) If I want to do a moving average of the volume of the last 10
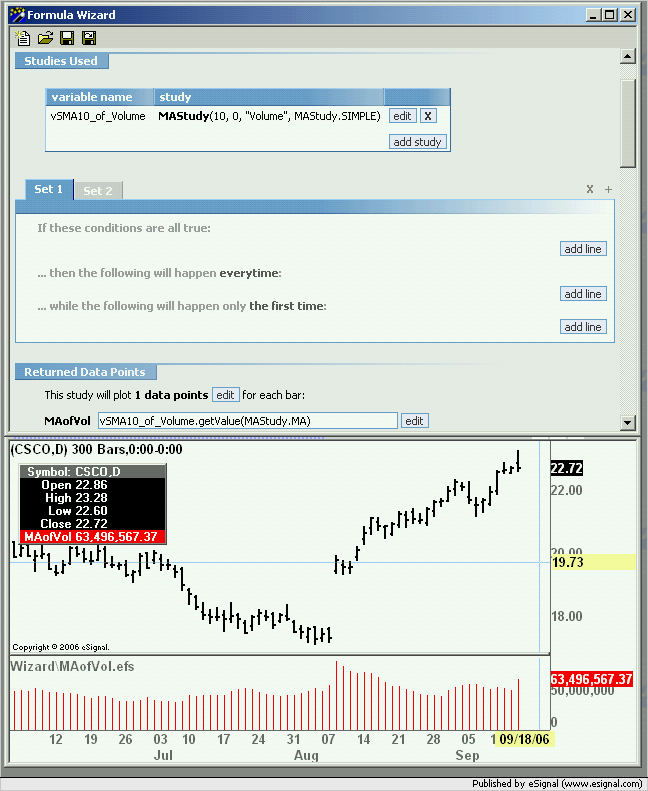
    days, I tried with the formula wizard, but something went
    wrong.
    Also the scale of the indicator is wrong.
    I send you my syntax as a screenshot.

    Thanks

    Best regards

  • #2
    EFS file sharing

    HEre is the syntax file
    Attached Files

    Comment


    • #3
      Marknav
      Regarding points 1) and 2) you may want to provide a link to those formulas.

      3) The price source for the average needs to be "Volume" and not "volume" . To correct this click the Edit button next to the study then in the Function Editor dialog box click the priceSource field and from the dropdown list select "Volume" (see following image).


      The reason you are getting a different value when using "volume" is because the Formula Wizard does not recognize "volume" as a price source and so defaults to "Close". In fact if you compute a 10 period moving average of the Close you will get 22.20 which is the value shown in the indicator pane of your image.
      Alex

      Comment


      • #4
        Hello Alex,

        I send you the link of the other two questions as you told me, with the same questions.


        I have downloaded the following files:

        1) Positive volume- Negative volume
        2) Volume with MA

        R1)What's postive volume? Is it refers to the close of the bars or
        to the previous day volume? I suppose neither of these
        answers.

        R2) About volume with MA, simply plot on the volume indicator a
        simple moving average?

        Thank you.

        Comment


        • #5
          Marknav
          1) Here is how the Positive Volume Index (PVI) is calculated

          Start with PVI[yesterday] AND
          IF (Volume[today] is greater than Volume[yesterday]) THEN ADD
          ((Close[today] - Close[yesterday]) / Close[yesterday]) * PVI[yesterday]
          ELSE ADD 0

          2) That is correct. The study plots the Volume and its average
          Alex

          Comment

          Working...
          X